Running tab of macro indicators: 9 out of 20
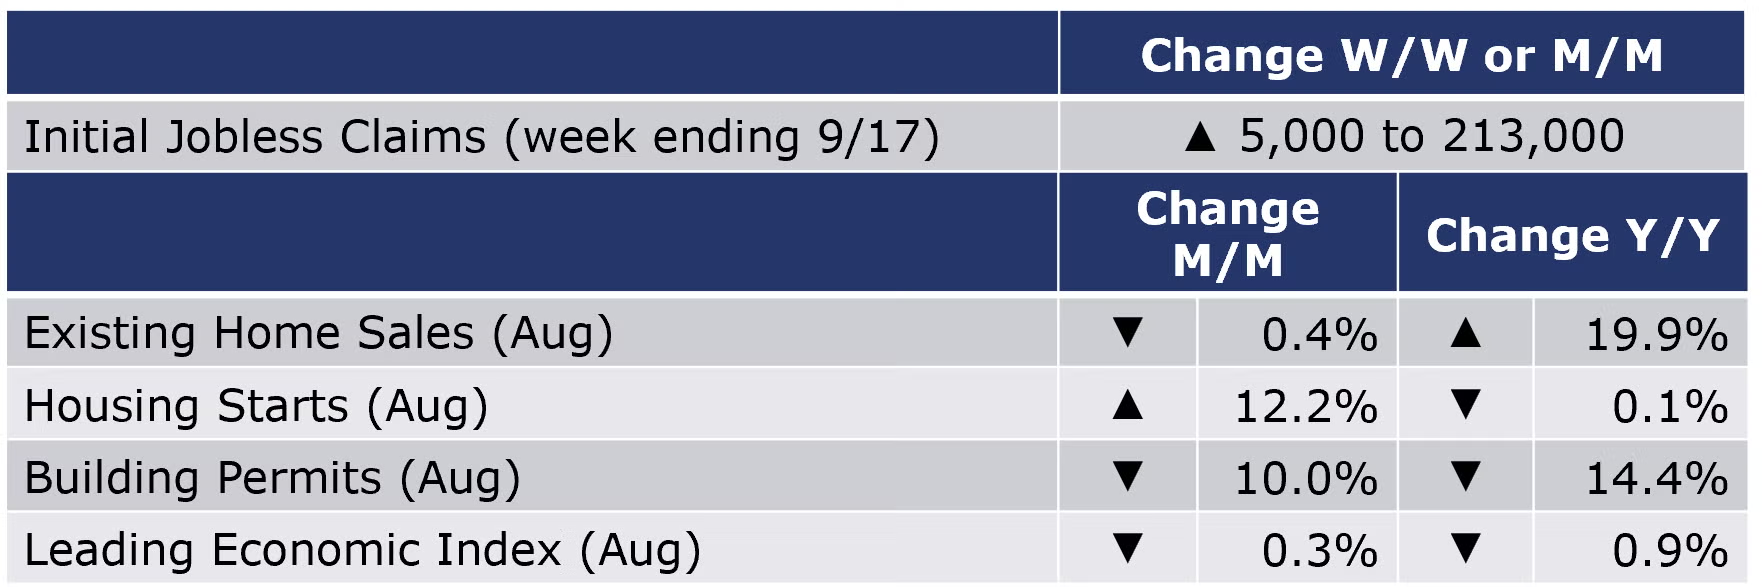
The number of new jobless claims rose by 5,000 to 213,000 during the week ending 17 September – the first increase in seven weeks. Continued claims declined 2,200 from the previous week’s level, to 1,379,000. Both new jobless claims and continued claims last week have been revised downwards, reflecting a strong labor market. The insured unemployment rate for the week ending September 10 was unchanged at 1.0%.
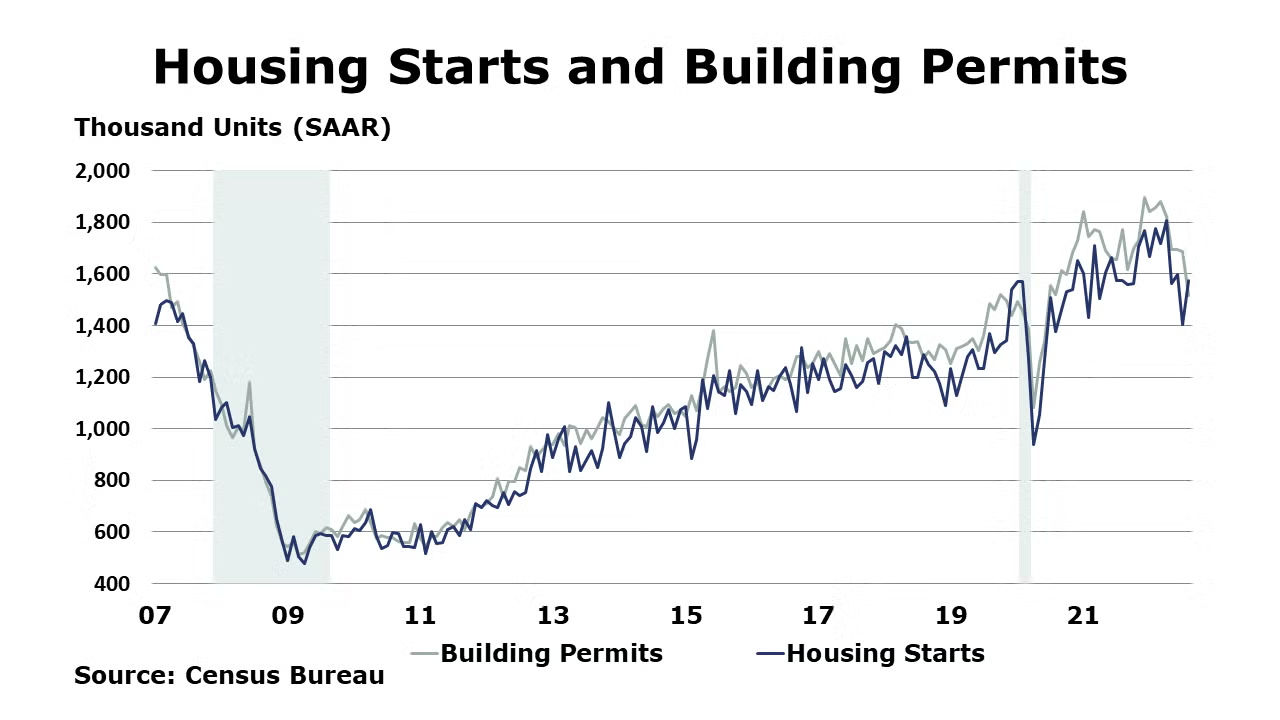
Total housing starts jumped by 12.2% to a 1.58 million pace after three months of consecutive decline. While the reverse in direction was largely unexpected, the levels remained below the cycle peak in December 2021. Most regions posted strong showings this month with the exception of the Northeast region, where housing starts declined. While activities increased in all segments, multi-family outperformed single-family with the best monthly performance in 35 years. That said, with cost of homeownership continuing to rise, housing starts reversed direction again in September. Forward-looking building permits, however, were down 10.0% to 1.52 million units on a seasonally adjusted at annual rate basis with all regions recording losses. It was the fifth consecutive month of decline since March 2022. While the weakness came from both segments, eroding affordability had a larger impact on single-family than multifamily. Rising mortgage rates will continue to exert downward pressure on construction activities going forward. Homebuilder confidence slid for a ninth consecutive month in August. The Wells Fargo/NAHB Housing Market Index fell 3 points to 46, suggesting that homebuilders are increasingly pessimistic as mortgage rates have topped 6% and homebuilding costs remain high.
As affordability deteriorated with rising mortgage rates, existing home sales declined 0.4% in August, a level still 19.9% higher Y/Y. Sales were down for the seventh month in a row to a SAAR of 4.80 million. The median sales price was up across all regions and 7.7% higher than the year before. The inventory of unsold existing homes was down at the end of the month after building the 5 previous months. NAR Chief Economist Lawrence Yun points out, "the housing sector is the most sensitive to and experiences the most immediate impacts from the Federal Reserve's interest rate policy changes."

The Conference Board’s Leading Economic Index® (LEI) fell 0.3% in August, slightly worse than expected, and following a 0.5% decline in July. It was the sixth consecutive decline. The index was down 2.7% over the previous six months, a reversal of the 1.7% growth over the previous six-month period. The LEI was off 0.9% Y/Y, the first annual decline since early-2021. The Conference Board projects a recession in the coming quarters.
SURVEY OF ECONOMIC FORECASTERS
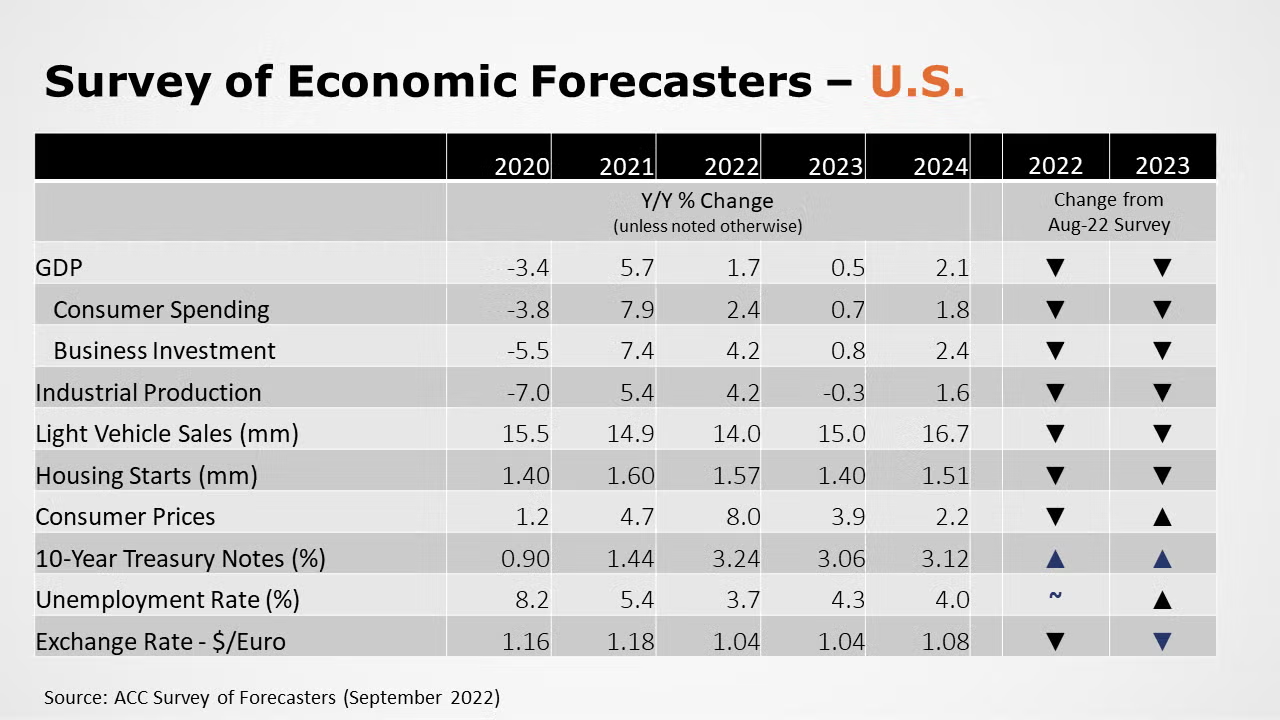
- The outlook for 2022 and 2023 continues to deteriorate as expectations rise for more aggressive interest rate hikes as the Fed seeks to get inflation under control. Growth is expected to continue to slow through mid-2023.
- Expectations for U.S. GDP were downwardly revised again and is now expected to grow by just 1.7% in 2022 as the post-lockdown rebound has quickly decelerated amid high inflation and aggressive increases in interest rates. In 2023, forecasters continue to expect U.S. to grow by 0.5%, well below its long-term trend.
- Consumer spending growth is expected to weaken to a 2.4% Y/Y pace in 2022 before slowing further to a 0.7% gain in 2023.
- While also slowing, business fixed investment will be a larger contributor to GDP growth in 2022 with an expected 4.2% gain. In 2023, growth in business investment slows further to a 0.8% gain, sharply lower than last month’s forecast.
- With much weaker growth in the second half of the year, industrial production, is expected to rise 4.2% in 2022 and to fall 0.3% in 2023, a reversal from expectations for a small gain last month.
- Higher borrowing costs and ongoing supply chain problems continue to hamper vehicle production and sales. As a result, expectations for light vehicle sales were lowered again to 14.0 million in 2022 (below 2020 when automakers were shut down for 2 months) and rising to only 15.0 million in 2023.
- As mortgage rates have moved above 6%, expectations for interest rate-sensitive housing were also lower. Housing starts are now expected to come in at 1.57 million in 2022, before slipping to 1.40 million in 2023.
- The unemployment rate is expected to average 3.7% in 2022 (unchanged from last month’s survey) and 4.3% in 2023, up from the August survey.
- With some easing in the July data, expectations for gains in consumer prices edged lower with forecasters looking for inflation of 8.0% in 2022, before easing to an above-trend 3.9% pace in 2023, which was higher than last month’s survey.
- Compared to last month, expectations for interest rates (10-year Treasury) rose as persistent inflation increases the likelihood of aggressive Fed tightening.
SURVEY OF ECONOMIC FORECASTERS – GLOBAL
- Forecasters have downgraded their expectations for global economic growth. Global GDP is expected to rise by 2.8% in 2022 and 2.4% in 2023.
- Industrial production, still hampered by ongoing supply chain challenges and other headwinds will rise 3.5% in 2022 and 3.1% in 2023.
- In addition to ongoing supply chain challenges, slower growth in global GDP and industrial production will be reflected in softer projections for global trade. Following a 10.5% rebound in 2021, global trade volumes are expected to rise by 3.5% in 2022 and 2.8% in 2023, slightly higher than previously expected for 2022 and the same for 2023.
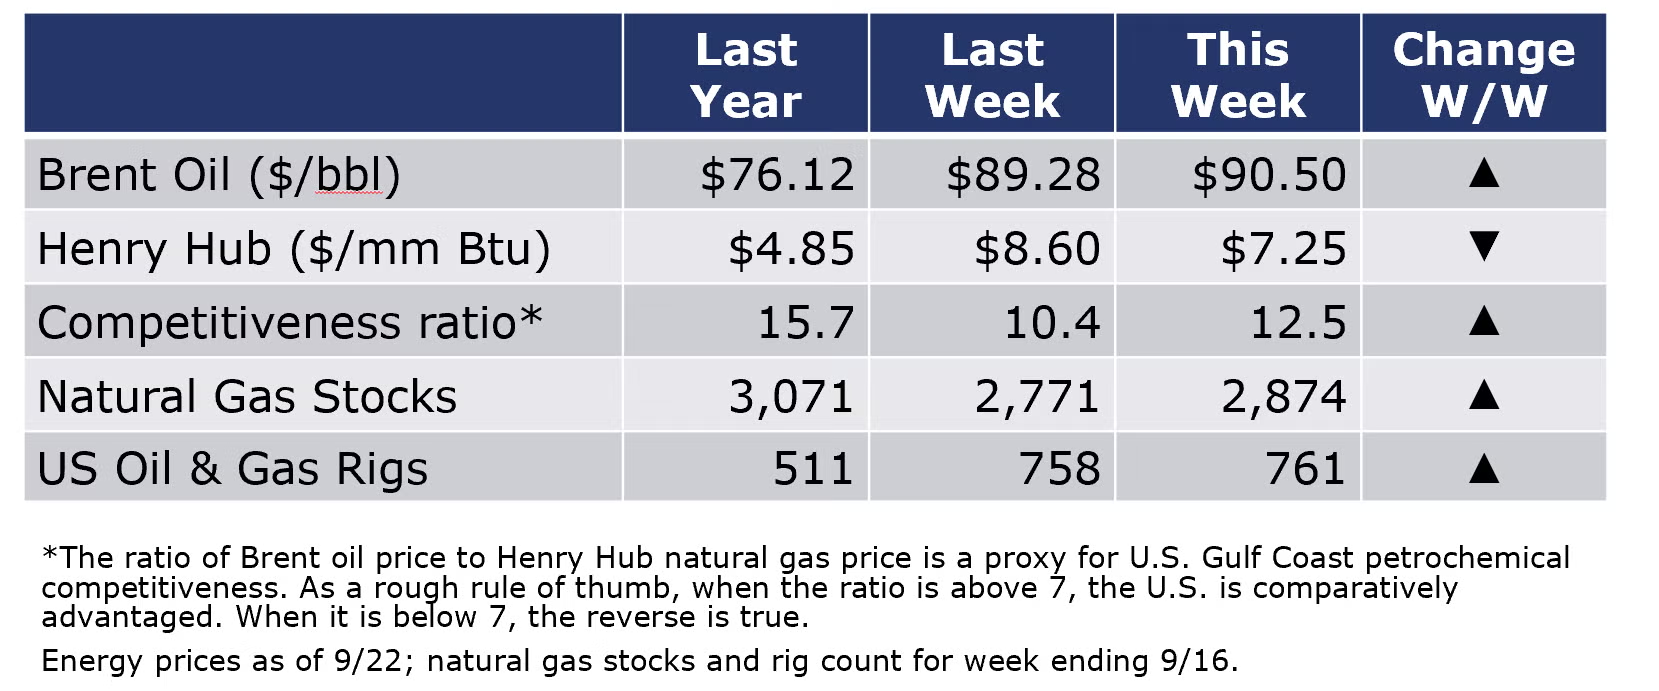
Energy prices were lower this past week. Oil was down after the Fed’s interest rate announcement and U.S. natural gas prices eased with higher production and a seasonal dip in demand. The combined oil and rig count rose by three to 761 during the week ending 9/16.
For the business of chemistry, the indicators still bring to mind a yellow banner for basic and specialty chemicals.

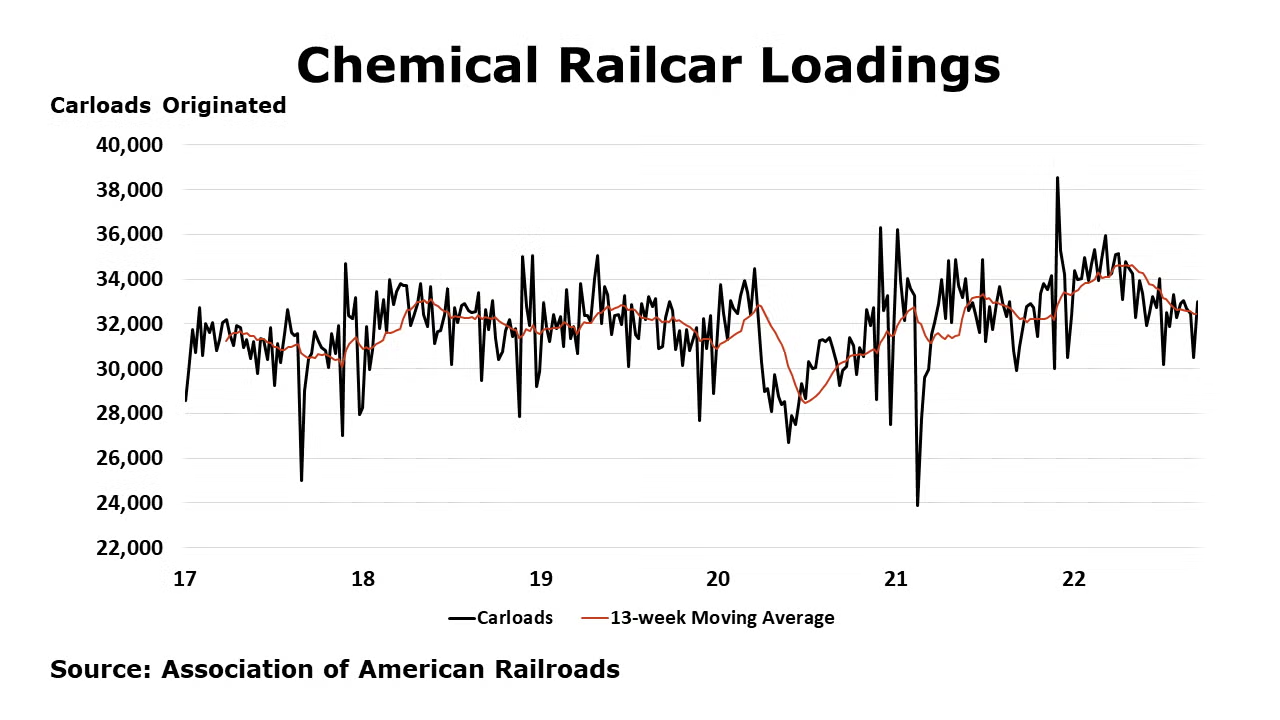
According to data released by the Association of American Railroads, chemical railcar loadings were up 8.2% to 32,977 during the week ending 17 September. Loadings were up 0.6% Y/Y (13-week MA), 3.6% YTD/YTD and have been on the rise for six of the last 13 weeks.
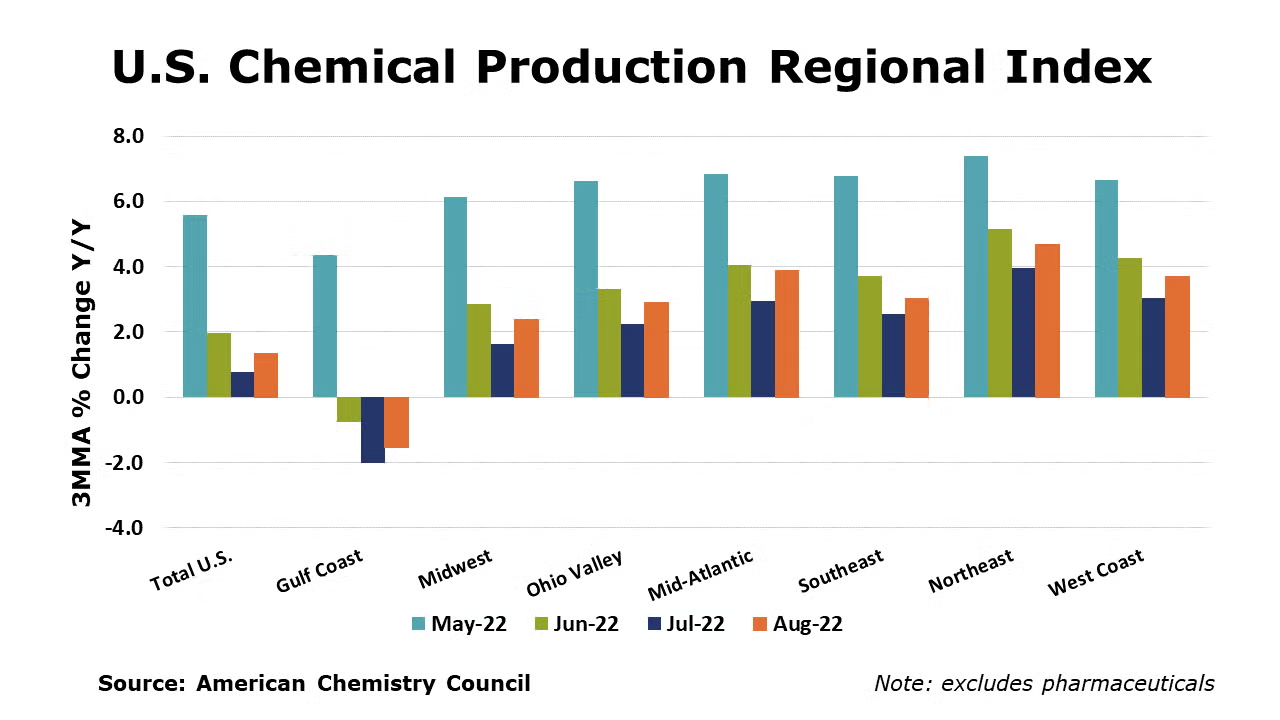
The U.S. Chemical Production Regional Index (U.S. CPRI) was flat in August following a 0.2% gain in July and a 0.1% decline in June, according to the American Chemistry Council (ACC). Chemical output was higher in all regions, except the Gulf Coast. The U.S. CPRI is measured as a three-month moving average (3MMA). Compared with August 2021, U.S. chemical production was ahead by 1.3%, a faster rate of growth than last month. Chemical production was higher than a year ago in all regions except the Gulf Coast, which was 1.5% lower.
On a 3MMA basis, chemical production within segments was mixed in August. There were gains in the production of coatings, adhesives, other specialty chemicals, consumer products, manufactured fibers, synthetic dyes & pigments, and industrial gases. These gains were offset by lower production of plastic resins, inorganic chemicals, organic chemicals, synthetic rubber, crop protection chemicals and fertilizers.
As nearly all manufactured goods are produced using chemistry in some form, manufacturing activity is an important indicator for chemical demand. Manufacturing output edged higher by 0.1% August (3MMA). The 3MMA trend in manufacturing production was mixed, with gains in the output of apparel, aerospace, rubber products, oil & gas extraction, plastic products, semiconductors, computers & electronics, petroleum refineries, foundries, and motor vehicles.
Note On the Color Codes
The banner colors represent observations about the current conditions in the overall economy and the business chemistry. For the overall economy we keep a running tab of 20 indicators. The banner color for the macroeconomic section is determined as follows:
Green – 13 or more positives
Yellow – between 8 and 12 positives
Red – 7 or fewer positives
For the chemical industry there are fewer indicators available. As a result we rely upon judgment whether production in the industry (defined as chemicals excluding pharmaceuticals) has increased or decreased three consecutive months.
For More Information
ACC members can access additional data, economic analyses, presentations, outlooks, and weekly economic updates through MemberExchange.
In addition to this weekly report, ACC offers numerous other economic data that cover worldwide production, trade, shipments, inventories, price indices, energy, employment, investment, R&D, EH&S, financial performance measures, macroeconomic data, plus much more. To order, visit http://store.americanchemistry.com/.
Every effort has been made in the preparation of this weekly report to provide the best available information and analysis. However, neither the American Chemistry Council, nor any of its employees, agents or other assigns makes any warranty, expressed or implied, or assumes any liability or responsibility for any use, or the results of such use, of any information or data disclosed in this material.
Contact us at ACC_EconomicsDepartment@americanchemistry.com