Running tab of macro indicators: 11 out of 20
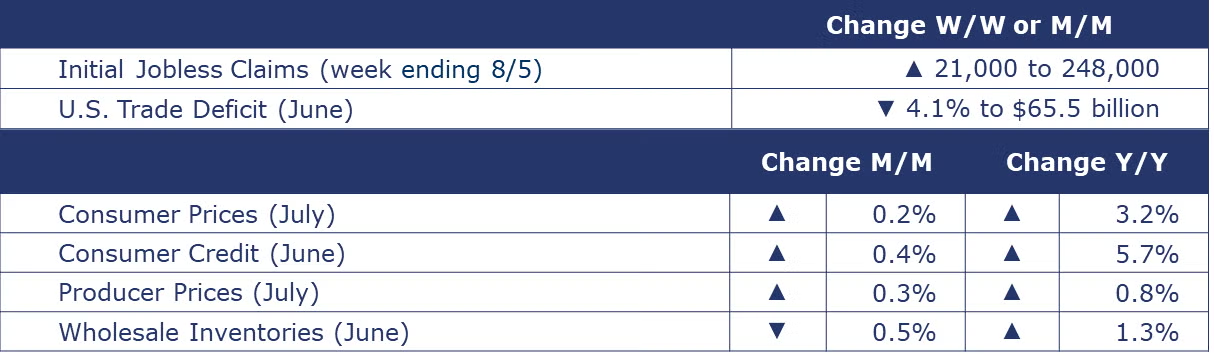
The number of new jobless claims rose by 21,000 to 248,000 during the week ending August 5. Continuing claims fell by 8,000 to 1.684 million, and the insured unemployment rate for the week ending July 29 was unchanged at 1.1%.
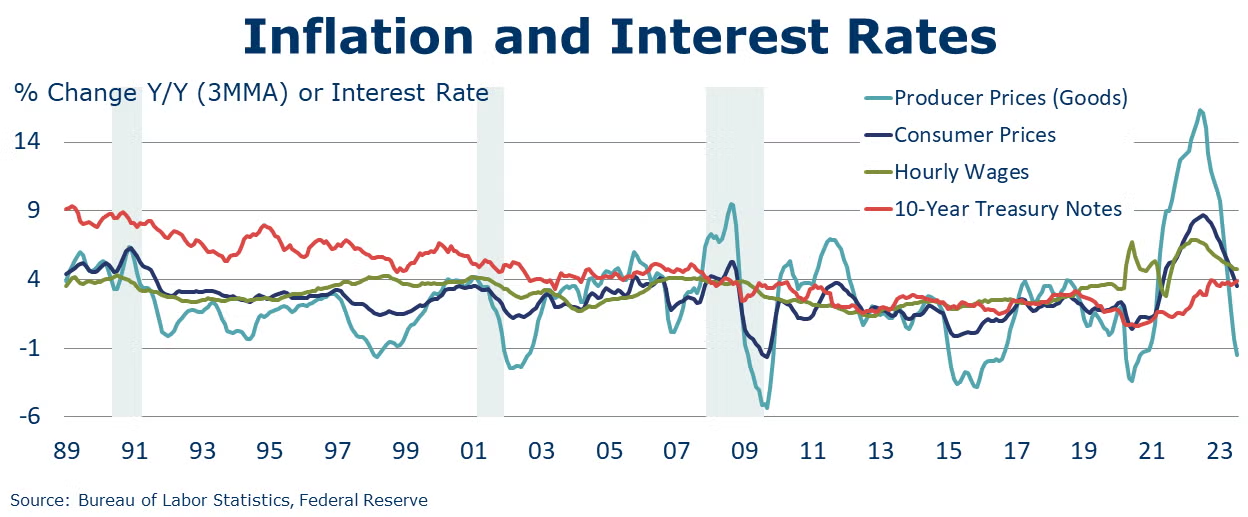
Headline consumer prices rose by 0.2% in July. The index for shelter was by far the largest contributor to the monthly all items increase, accounting for over 90% of the increase, with the index for motor vehicle insurance also contributing. Excluding food and energy, core consumer prices also moved higher by 0.2%. Headline consumer prices were up by 3.2% Y/Y, slightly ahead of June’s annual pace, while core consumer prices eased to a 4.7% Y/Y increase.
Following flat growth in June, producer prices rose 0.3% in July, the fastest pace since January and higher than analysts’ expectations. The gain was driven by an acceleration in prices for final demand services (up 0.5%) which are largely driven by labor costs. Prices for final demand goods rose a modest 0.1% driven mostly by higher prices for foods. Headline producer prices were up 0.8% Y/Y (higher than last month’s comparison) and core producer prices (excluding food and energy) rose at a 2.7% annual pace, the same as last month.
The U.S. trade deficit narrowed by 4.1% in June to $65.5 billion as imports fell faster than exports. Exports edged slightly lower on declining exports of industrial and consumer goods that was partially offset by higher capital goods exports. Imports fell for the fourth of the past six months as weakening consumer demand and lower inventory investment have curbed demand for goods from abroad.
The NFIB Small Business Optimism Index increased in July, but the index reading – for the 19th consecutive month – was below the historical average. Inflation and labor quality were the top concerns. Of the small business owners surveyed, 42% reported openings they could not fill—a concern reflected mainly in the construction, manufacturing, and transportation sectors.
Consumer credit increased by 0.4% (or 4.3% SAAR) in June. Revolving credit (i.e., credit card debt) moved lower while nonrevolving debt (i.e., car & student loans) rose sharply. Consumer credit was up 5.7% Y/Y. A separate report from the New York Fed found that credit card debt exceeded $1 trillion at the end of Q2 as consumers sought to maintain a higher level of consumption amid higher prices.
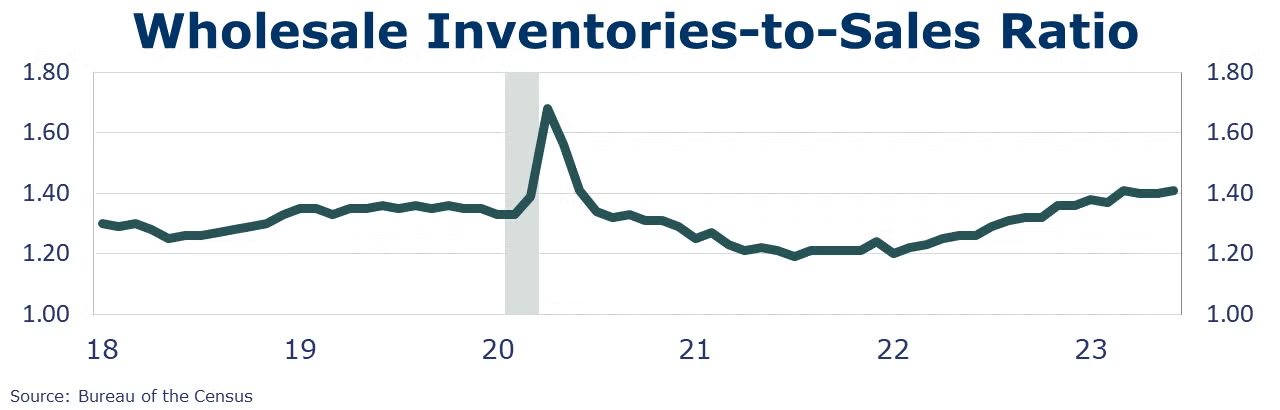
Wholesale sales fell slightly (by 0.7%) in June to the lowest level since December 2021, following a 0.4% decline in May. The largest monthly declines were in petroleum and farm products, while grocery and alcohol sales improved compared to the previous month. Wholesale inventories moved down driven by declines in metals, farm products, chemicals, and petroleum. Sales were down 6.7% Y/Y, while inventories were up 1.3% Y/Y. The inventories-to-sales ratio has remained relatively stable over the past three months, at 1.41 in June, 1.40 in May and 1.40 in April. A year ago, the ratio was 1.30.
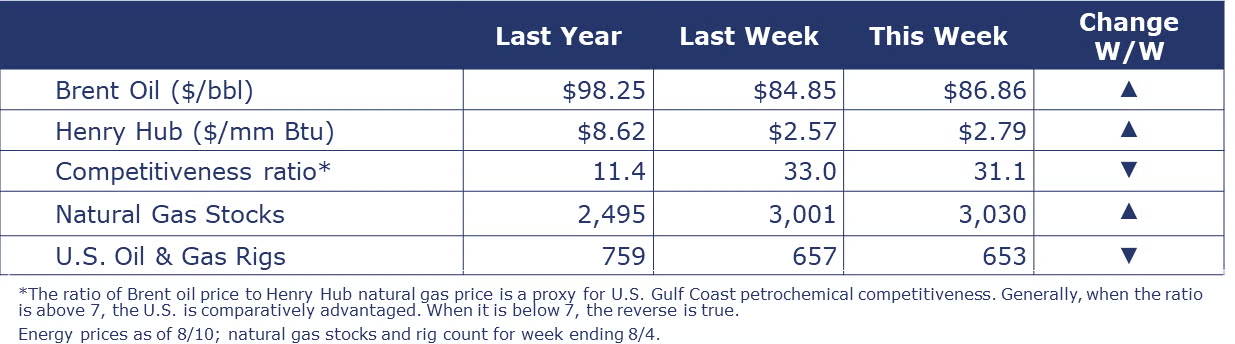
Oil prices were higher than a week ago as supplies continued to tighten on the extension of Saudi production cuts into August. A potential strike at LNG facilities in Australia (which represents 10% of global LNG) sent European and Asian LNG prices sharply higher this week. The combined oil and gas rig count continued to move lower, down by four to 653 during the week ending 4 August. The rig count has fallen every week except one over the past 3 months.
Indicators for the business of chemistry bring to mind a red banner.
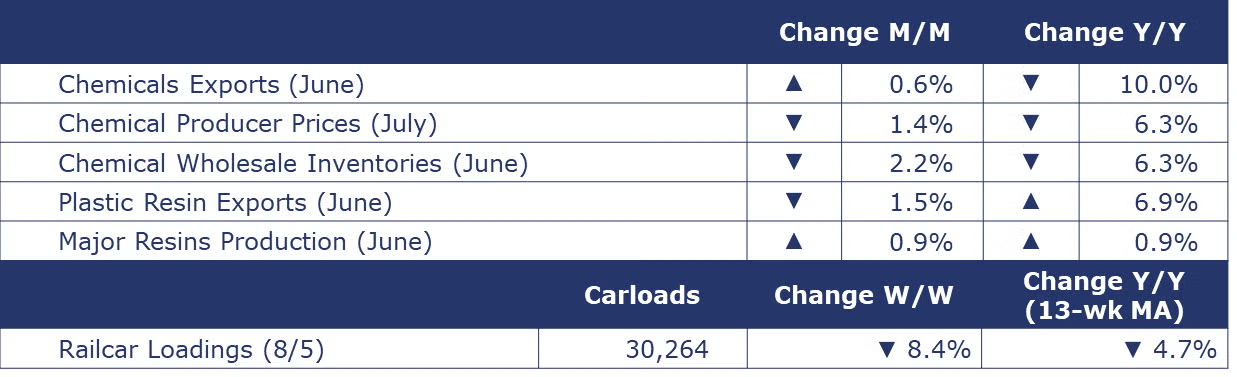
According to data released by the Association of American Railroads, chemical railcar loadings were down 8.4% to 30,264 for the week ending August 5. Loadings were down 4.7% Y/Y (13-week MA), down (3.7%) YTD/YTD and have been on the rise for 7 of the last 13 weeks.
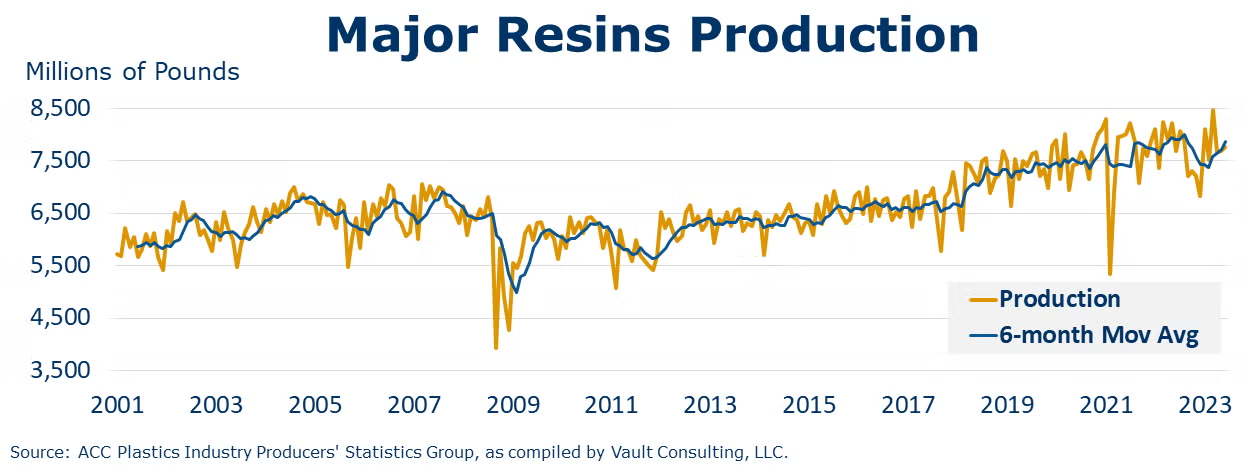
U.S. production of major plastic resins totaled 7.8 billion pounds during June 2023, up 0.9% compared to the prior month, and up 0.9% Y/Y, according to statistics released this week by ACC. Year-to-date production was 47.3 billion pounds, down 0.6% YTD/YTD. Sales and captive (internal) use of major plastic resins totaled 8.0 billion pounds, up 2.0% compared to the prior month and up 4.5% Y/Y. Year-to-date sales and captive use were 46.4 billion pounds, down 1.4% YTD/YTD.
U.S. plastic resin exports fell 1.5% in June to 1.77 million metric tons according to data from the International Trade Commission, the third monthly decline. U.S. resin exports were up 6.9% from a year earlier, however.
Chemical producer prices continued to move lower for a third straight month, down another 1.4%. Prices were lower for most categories, except manufactured fibers and consumer products. The largest M/M declines were in synthetic rubber, inorganic chemicals, and plastic resins. Compared to last July, chemical prices were off 6.3% with the largest Y/Y declines in agricultural chemicals, synthetic rubber, and plastic resins.
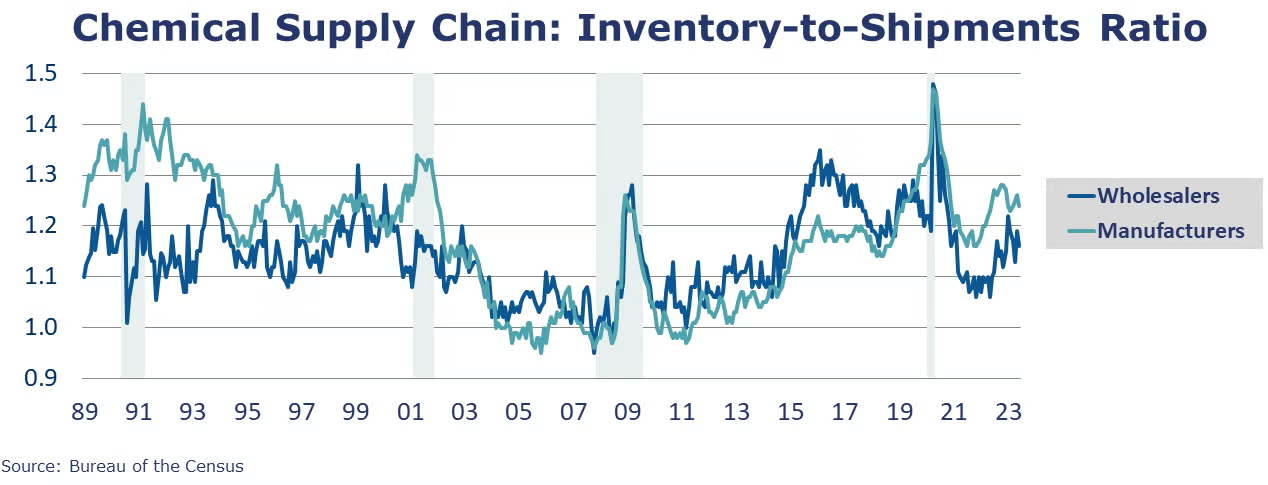
Wholesale chemical sales moved up 0.1% in June, following a 3.7% decline in May. Chemical wholesale inventories were down 2.2% following a revised 1.4% increase in May. Sales were down 8.6% Y/Y while inventories were down 6.3% Y/Y. The inventories-to-sales ratio for chemicals was down to 1.16 in June from 1.19 in May. A year ago, the ratio was 1.13.
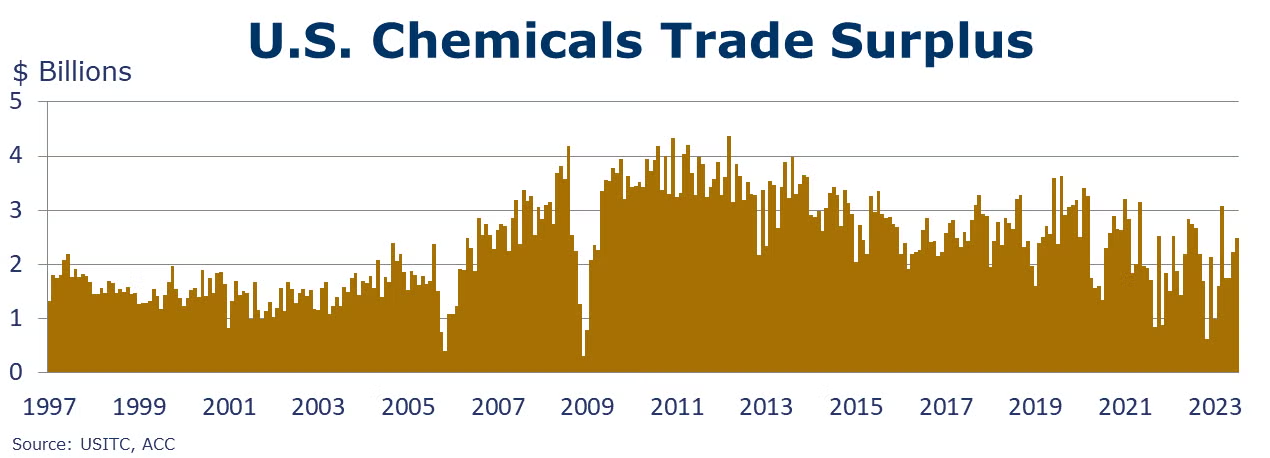
U.S. chemical exports rose by 0.6% in June to $14.2 billion. Chemical exports were $83.9 billion YTD, a level down 7.5% compared to H1 2022. Declines in exports of plastic resins and agricultural chemicals were offset by gains in bulk petrochemicals and intermediates, specialty chemicals and inorganics. U.S. chemical imports fell by 1.5% in June to $11.7 billion. Chemical imports were $71.7 billion YTD, a level down 8.4% compared to H1 2022. Imports were down in most categories in June except for specialties chemicals, inorganics and bulk petrochemicals and intermediates. The U.S. chemical trade surplus rose by $258 million to $2.5 billion in June. Over H1, the surplus has grown to $12.2 billion YTD, roughly the same level as H1 2022.
Note On the Color Codes
The banner colors represent observations about the current conditions in the overall economy and the business chemistry. For the overall economy we keep a running tab of 20 indicators. The banner color for the macroeconomic section is determined as follows:
Green – 13 or more positives
Yellow – between 8 and 12 positives
Red – 7 or fewer positives
For the chemical industry there are fewer indicators available. As a result, we rely upon judgment whether production in the industry (defined as chemicals excluding pharmaceuticals) has increased or decreased three consecutive months.
For More Information
ACC members can access additional data, economic analyses, presentations, outlooks, and weekly economic updates through ACCexchange.
In addition to this weekly report, ACC offers numerous other economic data that cover worldwide production, trade, shipments, inventories, price indices, energy, employment, investment, R&D, EH&S, financial performance measures, macroeconomic data, plus much more. To order, visit http://store.americanchemistry.com/.
Every effort has been made in the preparation of this weekly report to provide the best available information and analysis. However, neither the American Chemistry Council, nor any of its employees, agents or other assigns makes any warranty, expressed or implied, or assumes any liability or responsibility for any use, or the results of such use, of any information or data disclosed in this material.
Contact us at ACC_EconomicsDepartment@americanchemistry.com.