Running tab of macro indicators: 12 out of 20
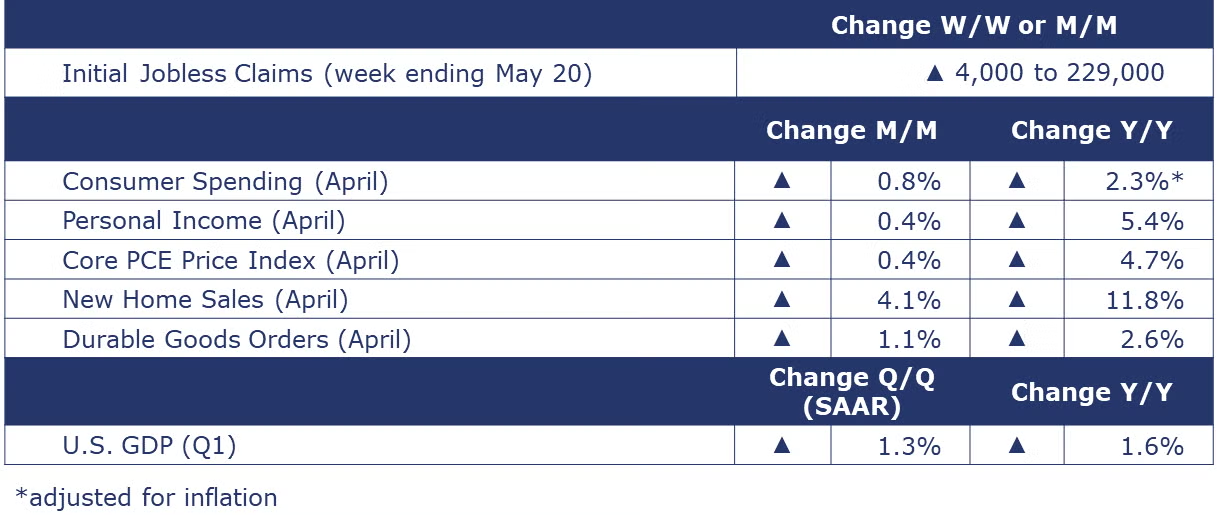
The number of new jobless claims rose by 4,000 to 229,000 during the week ending May 20. Continuing claims fell by 5,000 to 1.79 million, and the insured unemployment rate for the week ending May 13 was unchanged at 1.2%.
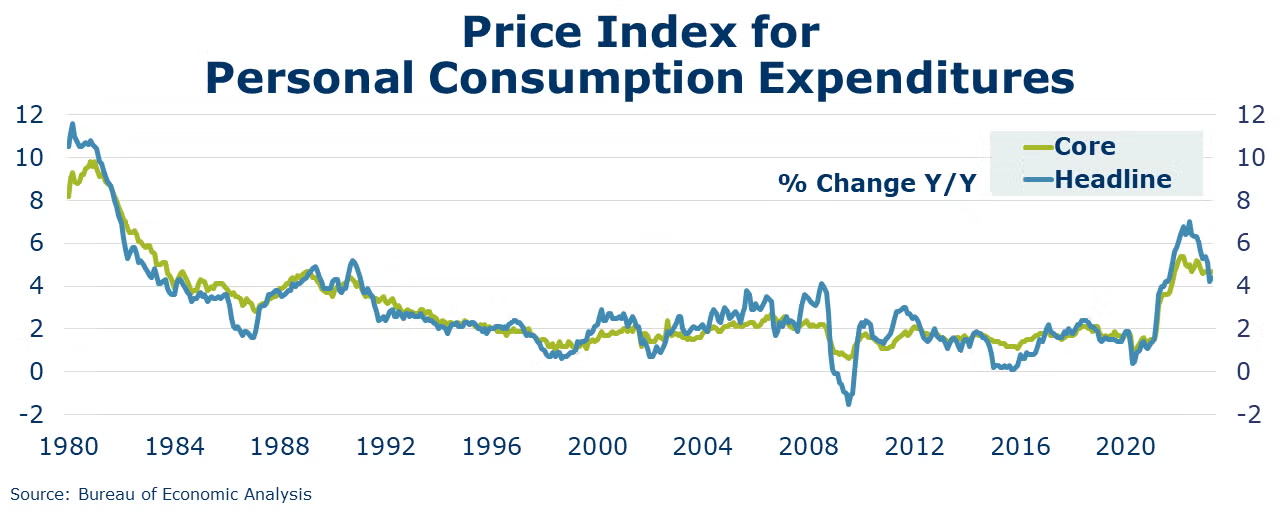
Consumer spending increased by 0.8% in April, a strong pace following two months of modest 0.1% gains. Both goods and services spending rose. Led by gains in rental income and compensation (private wages and salaries), personal income increased again in April and was 0.4% higher. With spending moving faster than income gains, the personal savings rate came down from 4.5% to 4.1% in April. The price index for personal consumption expenditures (PCE) had been easing so for this year but ticked up from a 4.2% Y/Y pace in March to a 4.4% Y/Y pace in April. The Fed looks at the “core” PCE price index as it targets a lowering inflation. The core index excludes food and energy. The core index has hovered around a 4.6-4.7% Y/Y pace and rose from 4.6% to 4.7% in April. This latest news suggests persistent inflation and could mean continued monetary tightening moves by the Fed.
A large gain in defense capital goods orders boosted headline durable goods orders, which rose 1.1% in April. Core business goods orders were up 1.4% in April, interrupting a string of monthly declines as slowing demand for goods has been dampening business investment in capital equipment. Headline orders were up 2.6% Y/Y while core business orders were ahead 2.7% Y/Y.
New home sales rose for a second month in April, up by 4.1% in April. Sales activity rose in the Midwest and South regions, offsetting declines in the rest of the country. Inventories of new homes available for sale also edged higher. As sales growth outpaced growth in inventories, the months’ supply moved lower from 7.9 in March to 7.6 in April, the lowest in a year. With extremely low inventories of existing homes, due to homeowners’ reluctance to give up low mortgage rates, there has been renewed activity in newly built homes. New home sales were up 11.8% Y/Y.
The second estimate of real GDP showed an annual growth rate of 1.3% in the first quarter of 2023, slightly higher than the first estimate released last month. Increases in consumer spending, exports, government spending and nonresidential fixed investment were offset by decreases in private inventory investment and residential fixed investment. Imports also increased. Fourth quarter GDP was revised upward to 2.6%. The deceleration in real GDP growth in Q1 is due primarily to reduced private inventory investment (particularly wholesale trade and manufacturing) and a slowdown in nonresidential fixed investment. The annual growth of the personal consumption expenditure (PCE) index—a primary inflation index—increased 4.2%, compared to 3.9% in Q4. Excluding food and energy prices, the PCE price index increased 5.0% in Q1 compared to 4.4% in Q4.
ACC SURVEY OF FORECASTERS – GLOBAL
The outlook for the global economy is for continued weakening through this year. The global economy is forecast to expand about 2.3% in 2023. Growth will pick up only modestly in 2024 to a 2.6% pace.
Global supply chains are functioning with more ease. That has helped some key markets like autos but, for the most part, easing supply chain pressures have presented as overall goods demand has weakened which has lowered traffic volume. Export demand has softened, somewhat explained by factors including inflation and consumers turning inward toward domestic endeavors and towards services (over goods). World trade growth will lag overall economic growth this year before a modest rebound in 2024.
Monetary policy efforts around the world have continued to aggressively target lowering inflation. Pressures persist and some areas are proving sticky. As it shakes out, however, global inflation is edging down, albeit stubbornly. Following an 8.1% pace in 2022, inflation growth will moderate to a 5.9% pace in 2023 and further to 4.2% in 2024. Global inflation is forecast to settle down to just 3% average growth by the end of 2031.
Global manufacturing activity has slowed down notably from a 2.9% pace in 2022 and will gain just 0.3% in 2023. In many sectors, manufacturers are working down inventories. Weaker demand for goods will pace the flow of new orders for production. Higher interest rates will discourage new investments and demand for related materials especially in interest rate sensitive end-use markets like building and construction. Forecasters anticipate some output performance diversity across sectors and regions. Manufacturers in the auto supply chain will benefit from the rebuilding occurring in that sector.
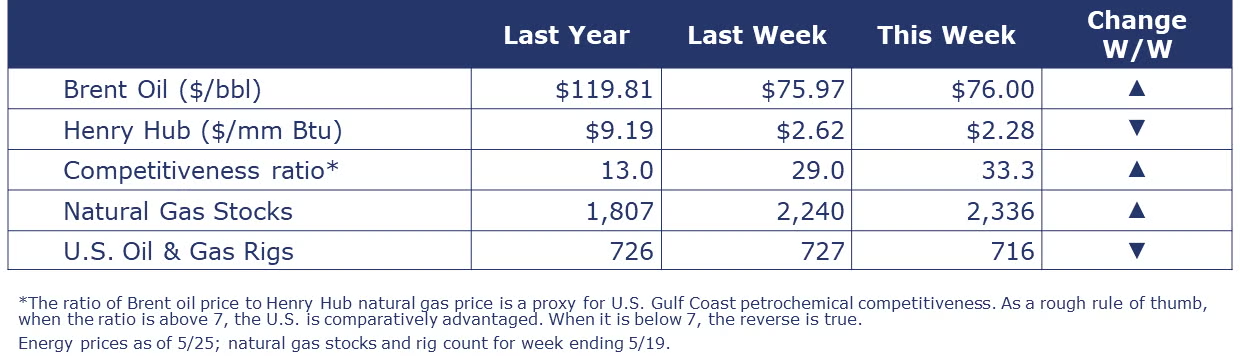
Oil prices moved slightly higher this week on an unexpectedly large drop in U.S. crude inventories. U.S. natural gas prices were little changed during the week. European gas prices have fallen to two-year lows on weak demand expectations, especially from the industrial sector. The combined oil and gas rig count fell for a third week, down by 11 to 716 and were lower than a year ago. After peaking at the end of last year (at 782 at the beginning of December), the rig count has been drifting lower.
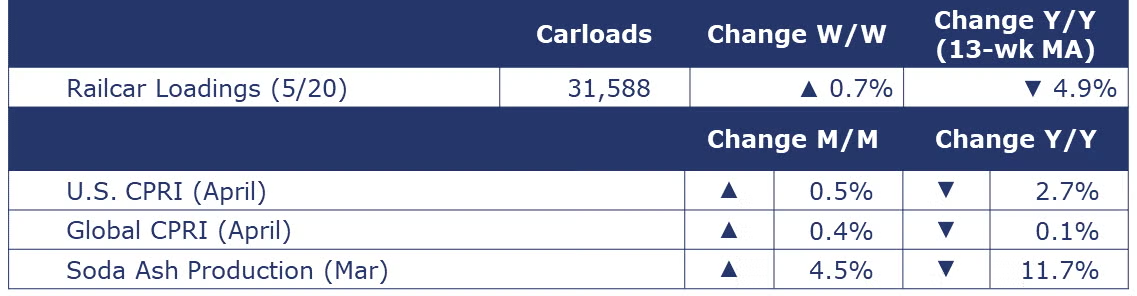
According to data released by the Association of American Railroads, chemical railcar loadings were up slightly (by 211 railcars) to 31,588 for the week ending 20 May. Loadings were down 4.9% Y/Y (13-week MA), down 5.2% YTD/YTD and have been on the rise for 7 of the last 13 weeks.
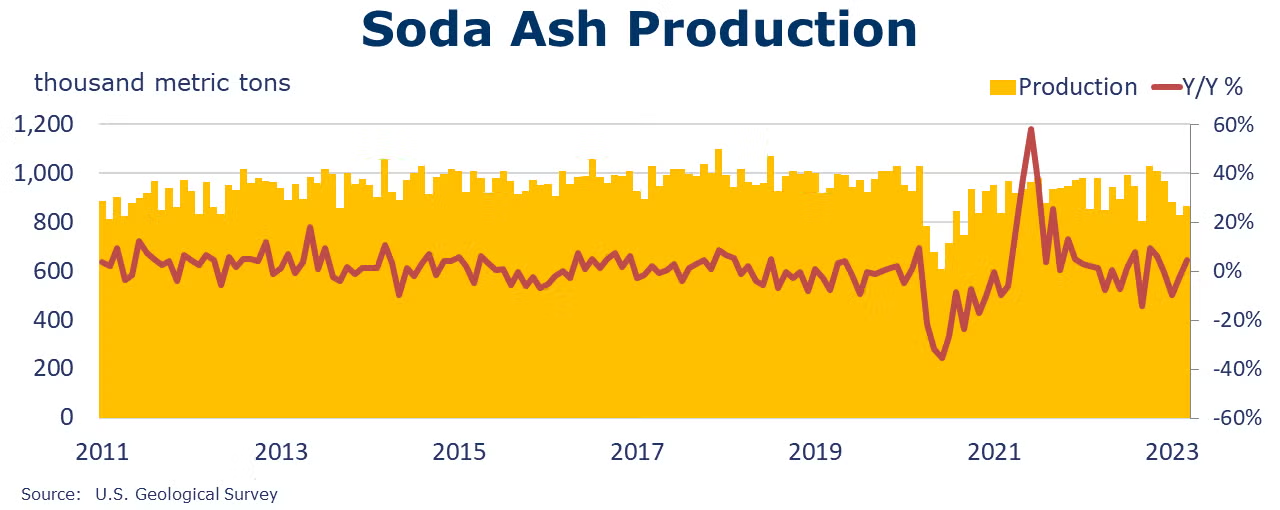
The U.S. Geological Survey reported that monthly production of soda ash in March was 868 thousand tons, up 4.5% compared to the previous month and down 11.7% Y/Y. Stocks fell 25.2% declined to 231 thousand tons at the end of the month, an 8-day supply. Ending stocks were down 18.9% Y/Y.
ACC’s U.S. Chemical Production Regional Index (U.S. CPRI) rose 0.5% in April. The index is measured on a three-month moving average (3MMA) basis to reduce month-to-month volatility. The gain in April reflects incremental improvement across several chemistries, especially those recovering from production outages during Q1. Going into Q2, inventories have moved into a more balanced position, and despite slowing momentum in manufacturing, several end-use markets have improved, in particular, motor vehicle production. U.S. chemical output was higher than a month ago in all regions, with the largest gain in the Gulf Coast, which has largely recovered after some production outages during Q1. Output remained lower than a year ago, however. Output of fertilizers, consumer products, organic chemicals, plastic resins, and inorganic chemicals trended higher. These gains were offset by lower production of synthetic rubber, paints & coatings, adhesives, and other specialty chemicals. Production of manufactured fibers was essentially flat.
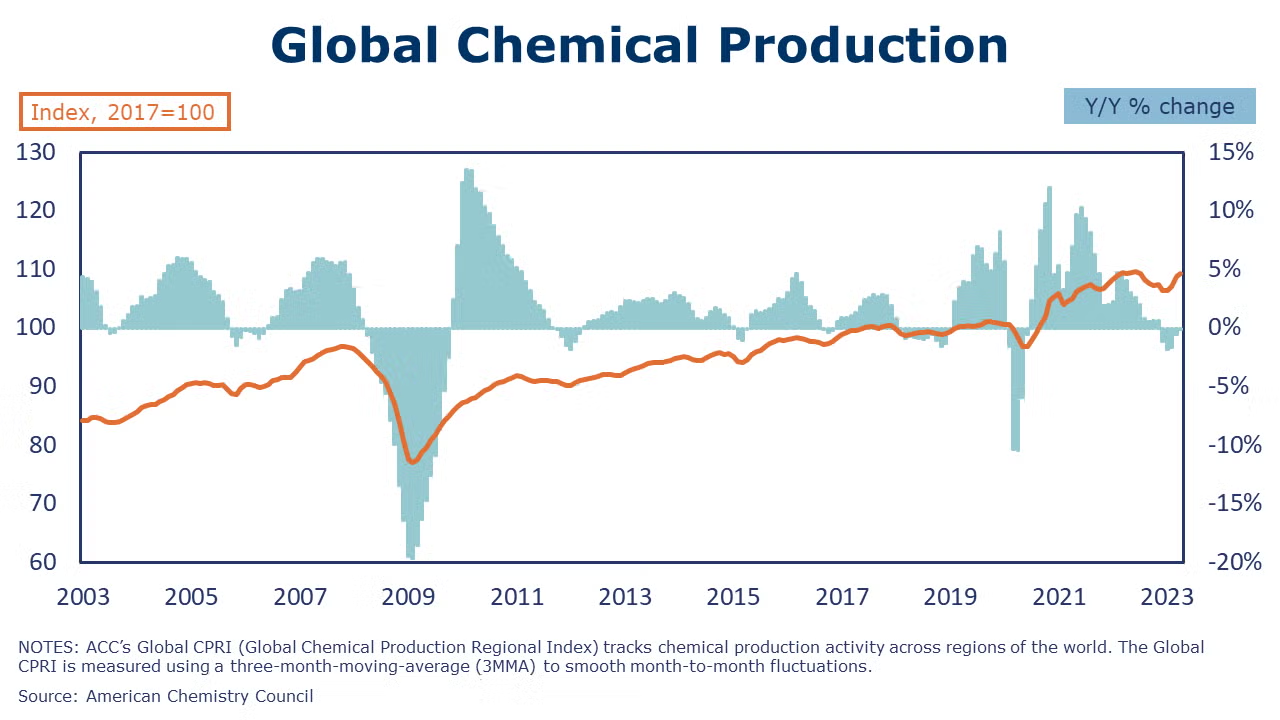
The Global Chemical Production Regional Index (CPRI) rose 0.4%(e) in April, according to data compiled by ACC. The gain follows a 1.6%(r) gain in March. Like the U.S. CPRI, the global CPRI is measured on a seasonally adjusted 3-month moving average basis. Chemical output was higher in all regions except South America. The largest gains in April were the Former Soviet Union (+0.8%) and Africa & Middle East (+0.5%). Output in Asia-Pacific rose 0.4%, including a 0.6% gain in Chinese chemical production. Within segments, the largest gains were in synthetic materials (0.6%), and coatings (+0.6%). Additional details on the Global CPRI will be available to members on ACCExchange in the next week or send an email to David_lan@americanchemistry.com to be added to a distribution list for the Global CPRI report.
Note On the Color Codes
The banner colors represent observations about the current conditions in the overall economy and the business chemistry. For the overall economy we keep a running tab of 20 indicators. The banner color for the macroeconomic section is determined as follows:
Green – 13 or more positives
Yellow – between 8 and 12 positives
Red – 7 or fewer positives
For the chemical industry there are fewer indicators available. As a result, we rely upon judgment whether production in the industry (defined as chemicals excluding pharmaceuticals) has increased or decreased three consecutive months.
For More Information
ACC members can access additional data, economic analyses, presentations, outlooks, and weekly economic updates through ACCexchange.
In addition to this weekly report, ACC offers numerous other economic data that cover worldwide production, trade, shipments, inventories, price indices, energy, employment, investment, R&D, EH&S, financial performance measures, macroeconomic data, plus much more. To order, visit http://store.americanchemistry.com/.
Every effort has been made in the preparation of this weekly report to provide the best available information and analysis. However, neither the American Chemistry Council, nor any of its employees, agents or other assigns makes any warranty, expressed or implied, or assumes any liability or responsibility for any use, or the results of such use, of any information or data disclosed in this material.
Contact us at ACC_EconomicsDepartment@americanchemistry.com.

