Running tab of macro indicators: 6 out of 20
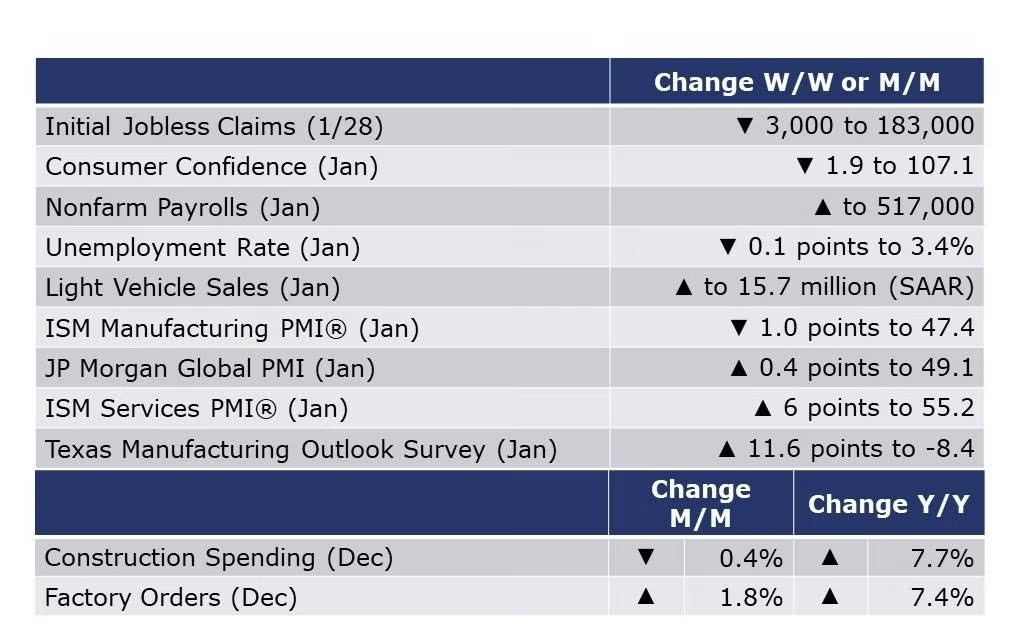
Nonfarm payrolls surged by 517,000 in January, surpassing expectations for moderating job growth. It was the largest monthly gain since July. In contrast to the ISM Manufacturing PMI report, the manufacturing sector continued to add workers, increasing payrolls by 19,000. Hourly earnings growth slowed to 4.4% Y/Y, down from 4.8% Y/Y in December. While still too high, it provides some evidence that Fed tightening is having an impact. The average workweek also expanded to 34.7 hours, its highest level in nearly a year. The unemployment rate fell to 3.4%, a 54-year low. The decline in the unemployment reflects, in part, higher labor force participation. The participation rate, which has been slow to return to its pre-pandemic level, rose to 62.4%, the highest rate since last March, but still below pre-pandemic rates. The report suggests that the labor market remains remarkably tight. If the economy can continue to add jobs and reduce wage growth, it could indicate that a soft landing is achievable.
The number of new jobless claims fell by 3,000 to 183,000 during the week ending 28 January. Continuing claims fell by 11,000 to 1.67 million, and the insured unemployment rate for the week ending 21 January was unchanged at 1.1%.
The Conference Board Consumer Confidence Index® fell to 107.1 in January (from 109.0 in December, which was revised upward). Consumers’ assessment of present economic and labor market conditions improved at the start of 2023, however, consumer expectations retreated in January, reflecting their concerns about the economy over the next six months. Consumers were less upbeat about the short-term outlook for jobs. They also expect business conditions to worsen in the near term. While purchasing plans for autos and appliances held steady, fewer consumers indicated they would buy a new home in the short-term.
The ISM Services PMI increased by 6 points in January to 55.2% after contracting in December following 30 consecutive months of growth. A reading above 50 percent indicates the services sector economy is generally expanding; below 50 percent indicates it is generally contracting. Most indicators that showed contraction in December reversed trend in January, while employment and supplier deliveries remained unchanged. Inventory sentiment improved but remained in the ”too high” territory. Comments from respondents suggest notable improvement in the supply chain situation.

Light vehicle sales started the year off on a high note, jumping to a 15.7 million seasonally adjusted annual rate (SAAR), up from a 13.4 million pace in December. January’s rate of sales was the highest since May 2021. The gain reflected higher dealer inventories as supply chain pressures eased. Sales of both domestically-produced and imported vehicles were higher. The boost may be short-lived as higher rates on car loans and a weakening labor market are likely to dampen demand.
Construction spending declined 0.4% in December but was up 7.7% Y/Y. A 0.5% decline in nonresidential construction was partially offset by a 0.3% drop in residential. Spending on multi-family home construction rose 3.2% while spending on single family home construction fell 2.3%. Lower non-residential spending was influenced by a 2.2% loss in manufacturing which was up 42.8% Y/Y. Public spending on construction fell by 0.4% but was 11.7% higher Y/Y.
Headline factory orders (which are not adjusted for inflation) rose 1.8% in December. The gain reflects a surge in aircraft orders which offset lower orders for construction materials, information technology, and consumer goods. Core business orders (nondefense capital goods excluding aircraft) continued to ease, off by 0.1%. Unfilled orders (a measure of the manufacturing pipeline) rose 1.3% following flat growth in November. Shipments of manufactured goods were lower for a second month, down by 0.7%. Inventories, however, were up 0.4%, following flat growth in November. As a result the inventories-to-shipments ratio moved higher from 1.47 in November to 1.49 in December, the highest level since last December (when the ratio was also 1.49).
At 47.4%, the ISM’s Manufacturing PMI® contracted in January for the third consecutive month following a 28-month period of growth. Out of 18 industries tracked, only two expanded. Demand continues to soften, with new orders continuing to decline. Measures of supply chain bottlenecks continued to improve, resulting in easing price growth. Output/Consumption (measured by the Production and Employment indexes) was negative, with a combined 0.8-percentage point downward impact on the Manufacturing PMI® calculation. For new orders, none of the 18 industries reported growth.
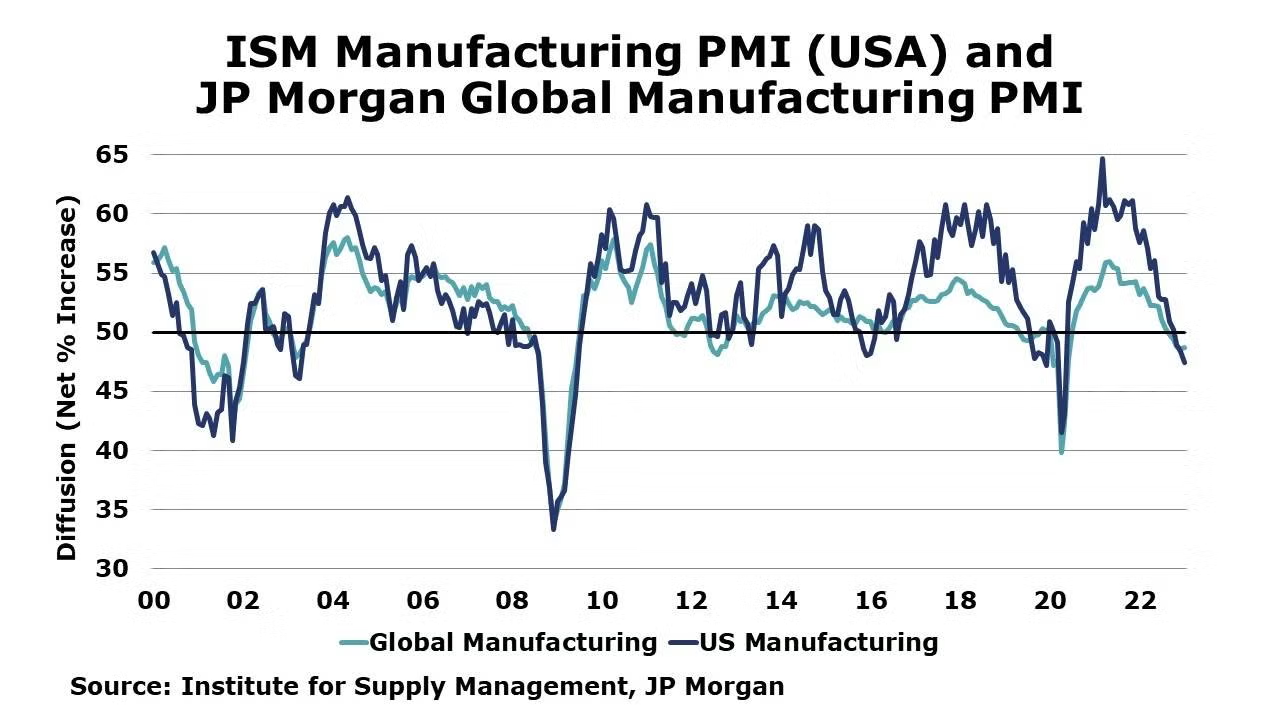
The JP Morgan Global Manufacturing PMI™ reading was 0.4 points higher at 49.1% in January. It was the fifth month in a row with a reading below 50, indicating sustained deterioration through the latter part of the year. Output continued to decline in January but at a slower rate. Looking at the sector breakdown, the drag is in intermediate goods. Output in consumer and investment goods rose for the second consecutive month. Both new goods orders and new export orders declined, but at a slower rate. Manufacturing jobs increased after falling the last two months. Twenty-one of 29 countries with data had PMI readings indicating contraction in their manufacturing sector.
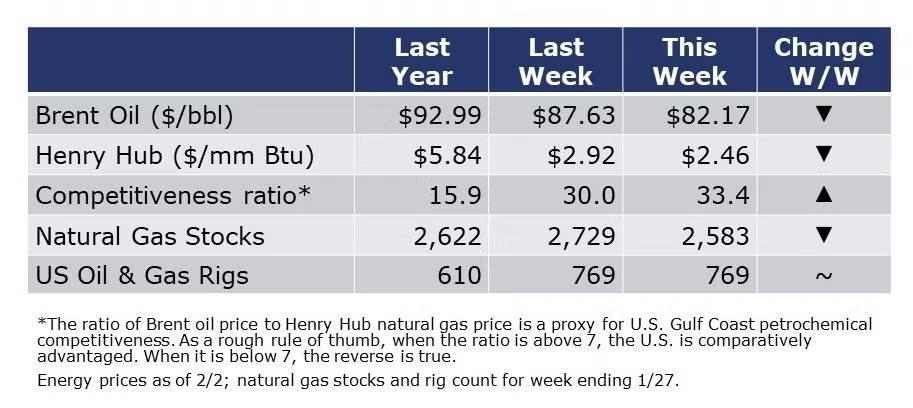
Oil prices moved lower during the week on weaker U.S. data, concerns about a slow rebound in China, and a higher dollar. Natural gas prices continue to fall below $2.50/mmbtu on a combination of weak demand (mild winter, industrial recession, etc.) and strong production gains. The combined oil and gas rig count was steady at 769 during the week ending 27 January.
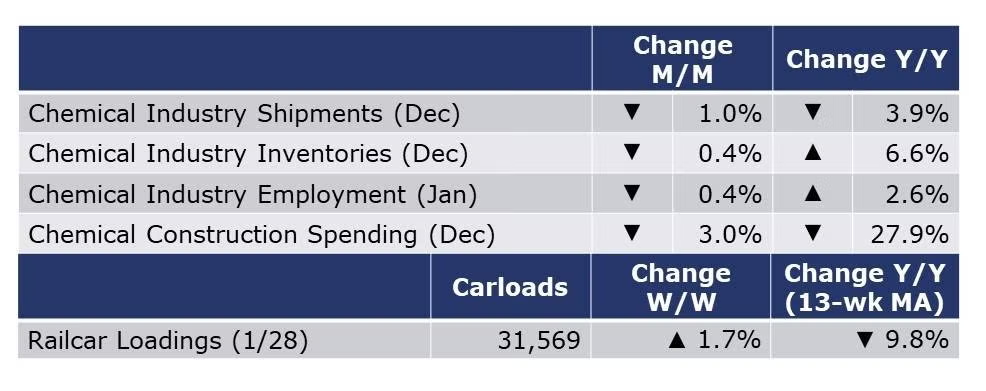
According to data released by the Association of American Railroads, chemical railcar loadings were up to 31,569 for the week ending January 28. Loadings were down 9.8% Y/Y (13-week MA), down (10.0%) YTD/YTD and have been on the rise for 8 of the last 13 weeks.
Within the details of the ISM Manufacturing PMI®, the chemical industry was reported to be in contraction in December. While there was growth in order backlogs for chemical products, there were contractions in production, new orders, export orders and employment. Imports of chemical products were also reportedly lower. Inventories were reported to be higher and supplier deliveries faster. Customer inventories were deemed to be “too high”. One respondent noted, “Conditions are reasonable. Sales are a little better than planned….there have been a lot fewer supply disruptions so far this year, and few expected in the short term. The crystal ball remains a little blurry for the rest of 2023.”
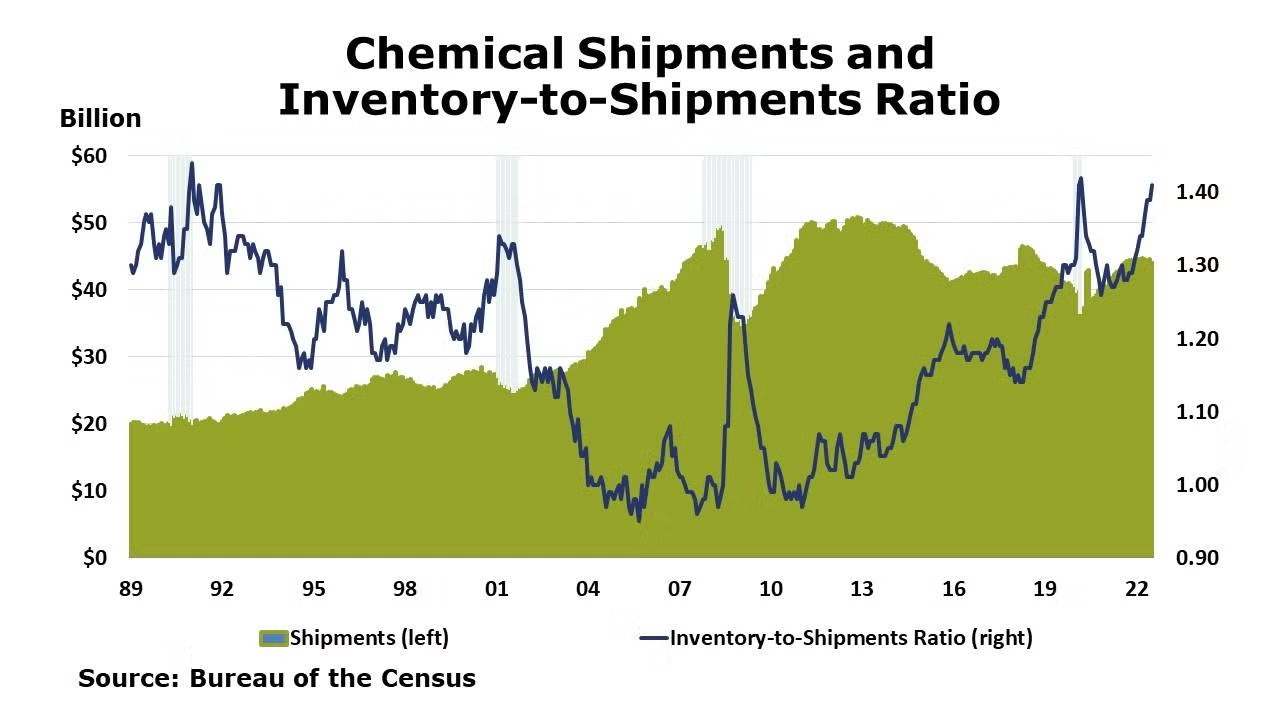
Chemical shipments fell for a fourth consecutive month in December, down 1.0%. The decline reflects both easing production and prices. Shipments of coatings and adhesives were higher but were more than offset by lower shipments of agricultural and all other chemicals. Chemical inventories also declined for a third month, down 0.4%, with declines across all main categories. Compared to a year ago, chemical shipments were off 3.9% Y/Y while inventories were up 6.6% Y/Y. In December, with shipments falling faster than inventories, the inventories-to-shipments ratio edged higher from 1.42 in November to 1.43 in December, the ratio’s highest level since 1991. The high level suggests further destocking to restore balance.
Chemical industry employment (including pharmaceuticals) fell by 3,500 (0.4%) in January with a large decline in production workers that was partially offset by higher employment in supervisory/non-production jobs. Compared to a year ago, chemical industry employment was higher by 23,000 (2.6%). Average hourly wages for production workers were up 7.8% Y/Y, a faster pace than December’s upwardly revised 5.9% pace of wage gains. The average workweek for chemical industry workers rose by 24 minutes in January to 41.6 hours and the total labor input into the chemical industry essentially flat in January. After factoring in productivity trends, this suggests that chemical output may have expanded slightly in contrast with the ISM report that suggested that the chemical industry output contracted.
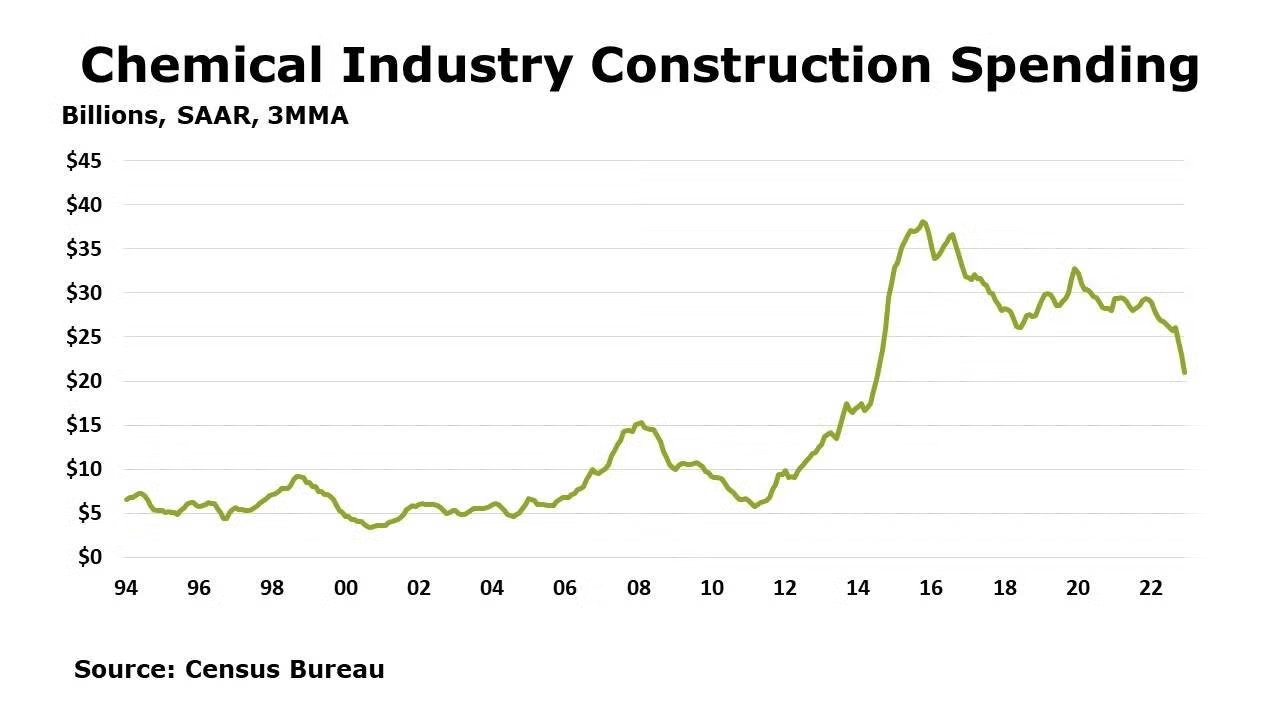
Chemical industry construction spending fell (by 3.0%) in December and was off by 27.9% Y/Y. Chemical construction spending as a percent of total manufacturing construction spending was 17.3% in December. The comparison has been softening gradually after climbing to a sustained high proportion (around 46%) during 2014-2017.
The U.S. Geological Survey reported that monthly production of soda ash in November was 1,010 thousand tons, down 1.9% compared to the previous month and up 6.3% Y/Y. Stocks rose 16.1% over October to 346 thousand tons at the end of the month, a 10-day supply. Ending stocks were up 21.4% Y/Y.
Note On the Color Codes
The banner colors represent observations about the current conditions in the overall economy and the business chemistry. For the overall economy we keep a running tab of 20 indicators. The banner color for the macroeconomic section is determined as follows:
Green – 13 or more positives
Yellow – between 8 and 12 positives
Red – 7 or fewer positives
For the chemical industry there are fewer indicators available. As a result we rely upon judgment whether production in the industry (defined as chemicals excluding pharmaceuticals) has increased or decreased three consecutive months.
For More Information
ACC members can access additional data, economic analyses, presentations, outlooks, and weekly economic updates through MemberExchange.
In addition to this weekly report, ACC offers numerous other economic data that cover worldwide production, trade, shipments, inventories, price indices, energy, employment, investment, R&D, EH&S, financial performance measures, macroeconomic data, plus much more. To order, visit http://store.americanchemistry.com/.
Every effort has been made in the preparation of this weekly report to provide the best available information and analysis. However, neither the American Chemistry Council, nor any of its employees, agents or other assigns makes any warranty, expressed or implied, or assumes any liability or responsibility for any use, or the results of such use, of any information or data disclosed in this material.
Contact us at ACC_EconomicsDepartment@americanchemistry.com

