Running tab of macro indicators: 6 out of 20
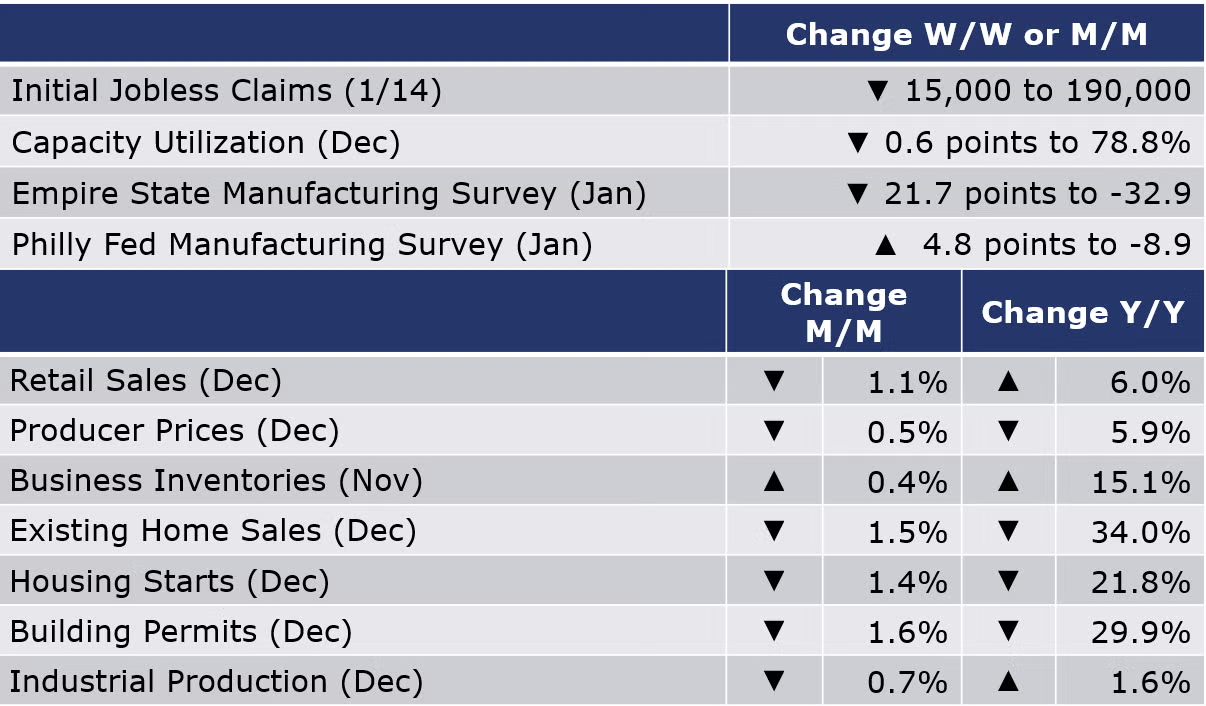
The number of new jobless claims fell by 15,000 to 190,000 during the week ending January 14. Continuing claims increased by 17,000 to 1.65 million, and the insured unemployment rate for the week ending January 7 was unchanged at 1.1%.
Nominal retail and food service sales were down 1.1% in December. It was the largest decline in a year and follows a 1.0% decline in November. Retail sales were up 6.0% compared to December 2021. While monthly sales were down in most segments, building materials and home and garden supplies, sporting goods and hobbies and general merchandise, and food and beverage registered gains compared to the month prior. While gasoline was down on a monthly comparison, it remained up 5.2% compared to December 2021. Restaurant sales which rebounded as pandemic restrictions eased also declined in December, signaling that consumers may be pulling back.
Led by a steep decline in fuel prices, headline producer prices fell by 0.5% in December, more than expected. Prices for services continued to edge higher but were offset by a sharp decline in goods prices. While prices for motor vehicles, pharmaceuticals, meats, and scrap steel were higher, prices fell for gasoline & diesel, lumber, steel mill products and grains. Excluding food and energy, core prices ticked higher by 0.1%. Compared to a year ago, headline prices were up 6.2% Y/Y while core prices were up 4.6% Y/Y. Both measures continued to decline, indicating an easing of pricing pressures.
Existing home sales fell 1.5% in December, the 11th consecutive decline. Compared to a year ago, sales were off 34.0%. Sales hit their lowest pace since November 2010 when the housing market was recovering from the financial recession. Existing home inventories continued to move lower and now represent a 2.9-month supply. The median sales price was 2.3% higher than a year ago. Higher mortgage rates have impacted affordability for both first time homebuyers and existing homeowners that took out mortgages when rates were historically low.
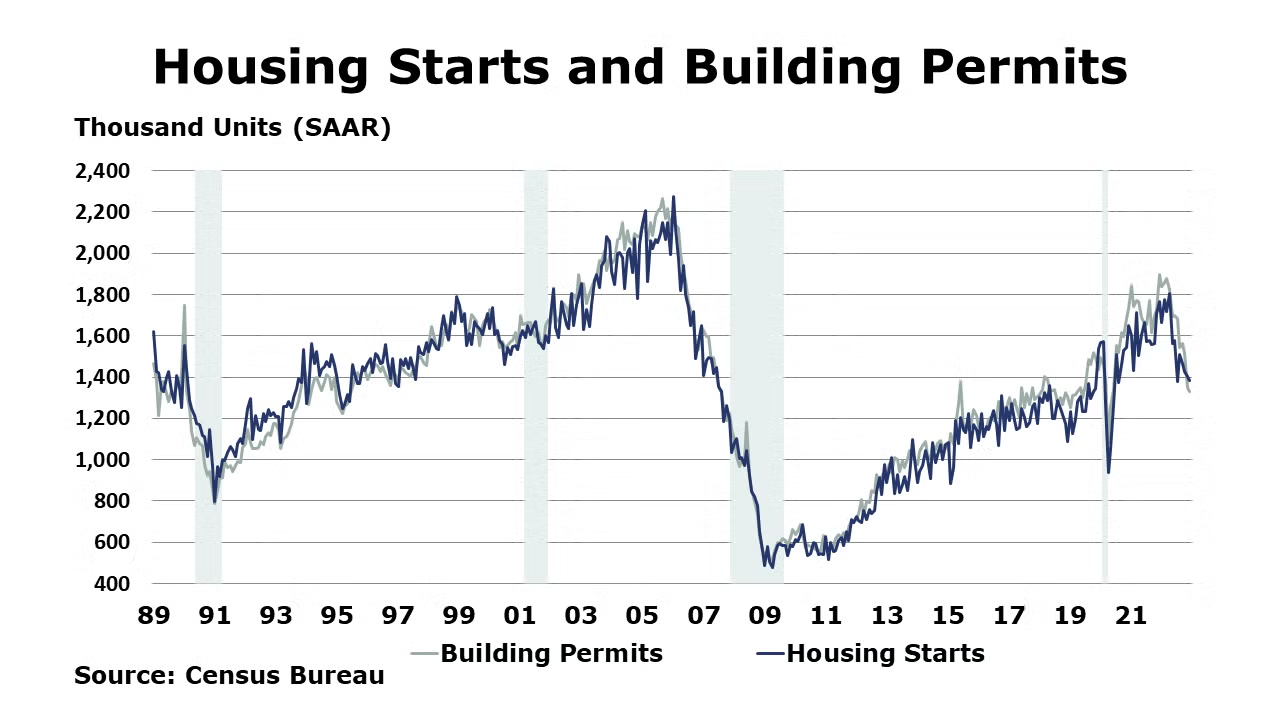
Homebuilding finished the year on a down note with a 1.4% decline in housing starts in December. It was the fourth consecutive decline and was the lowest level since the pandemic lockdowns. Single family starts were higher, however, up 11.3%, following three months of declines. Single-family starts were higher in all regions except Midwest. Forward-looking building permits also fell 1.6% (the 7th decline in the past 9 months) and were off 29.9% Y/Y. With mortgage rates nudging downward, homebuilders have become less pessimistic. Following 12 months of consecutive declines, the NAHB/Wells Fargo Housing Market Index rose four points to 35 in January. The reading remained below 50, indicating that homebuilders remain pessimistic about prospects for homebuilding activity in the near term.

Led by continued steep declines in mining and manufacturing output, industrial production ended the year with a whimper, down 0.7% in December. Manufacturing output fell 1.3% (following a downwardly revised 1.1% decline in November), with lower production in nearly all industries, except nonmetallic mineral products, fabricated metal products and aerospace. Compared to a year ago, industrial production was ahead 1.6% Y/Y, but manufacturing output was 0.5% lower from last December. Capacity utilization continued to move lower, down 0.6 points to 78.8%. This was slightly higher than a year ago when capacity utilization stood at 78.7%. Industrial capacity expanded 1.6% over the course of 2022.
The nominal value of combined business inventories continued to expand in November, up 0.4%, as inventories in wholesale gained notably (up 1.0%). Manufacturers’ inventories were unchanged while retail inventories were up slightly (by 0.1%) following a small draw-down in October. Combined business sales decreased (-0.8%) as sales fell in all sectors – retail, wholesale, and manufacturing. Compared to a year ago, business inventories were up 15.1% Y/Y while sales were up (7.4%). The inventories-to-sales ratio rose from 1.33 to 1.35 in November. A year ago, the ratio was 1.26.
SURVEY OF ECONOMIC FORECASTERS
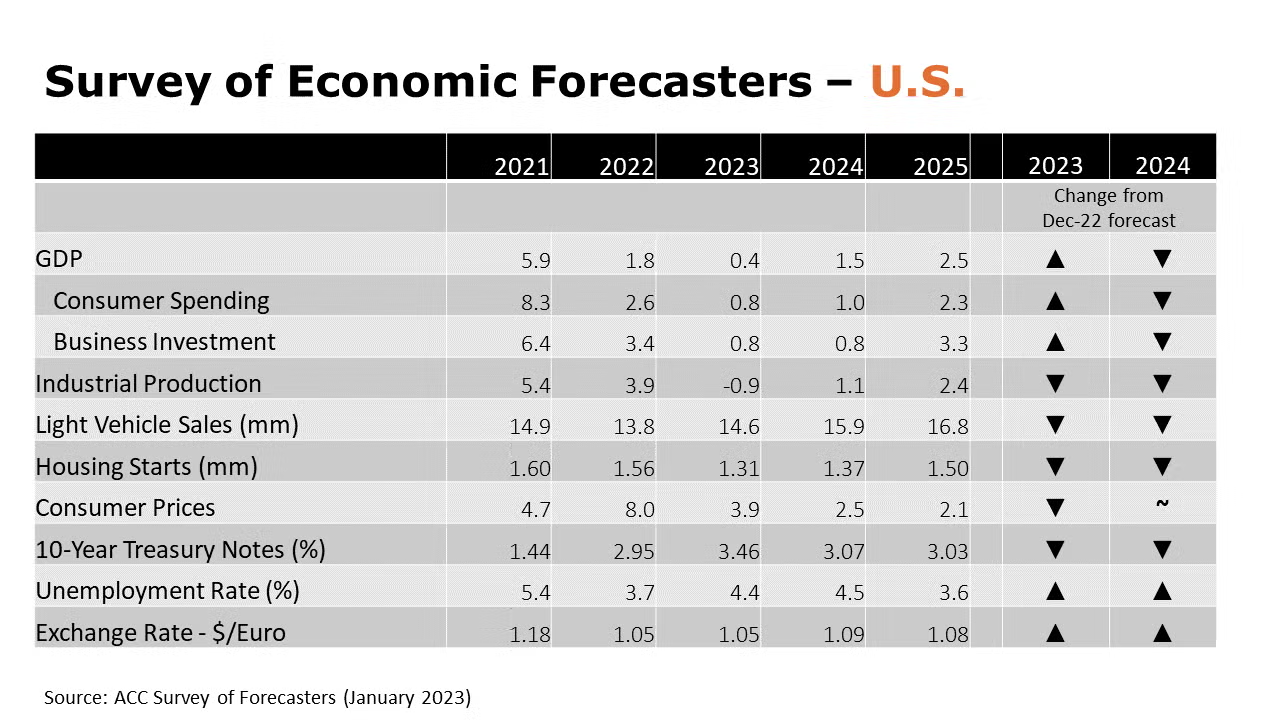
- At the start of the year, the outlook for 2023 has improved for several indicators. While we still see risks tilted toward a mild contraction in the U.S. economy, it’s possible the U.S. skates through without tipping into recession.
- Expectations for 2024, however, have deteriorated as weakness in consumer spending and business investment are expected to continue into 2024.
- U.S. GDP is expected to grow by a modest 0.4% in 2023 before expanding by a below-trend 1.5% in 2024.
- Consumer spending growth is expected to weaken to a 0.8% Y/Y pace in 2023 before rising by 1.0% in 2024.
- Business investment is expected to grow modestly, by 0.8% in both 2023 and 2024.
- With a decline that emerged at the end of 2022, industrial production is expected to decline further in the coming months, before recovering in the latter part of the year. In 2023, industrial production is expected to contract by 0.9% and grow only 1.1% in 2024.
- Despite recent improvement in semiconductor availability, higher borrowing costs and economic uncertainty will temper pent-up demand for vehicles that has accrued over the past three years. As a result, light vehicle sales are expected to grow to 14.6 million in 2023 (well below trend) and 15.9 million in 2024.
- As mortgage rates remain above 6%, growth in the interest rate-sensitive housing market will be challenged and a lower level of homebuilding is anticipated. Housing starts are forecast to come in at 1.31 million in 2023, before edging higher to 1.37 million in 2024.
- The unemployment rate is expected to move higher to 4.4% in 2023 and 4.5% in 2024.
- Following an 8.0% surge in consumer prices in 2022, growth in consumer prices are expected to decelerate to a 3.9% pace in 2023 and 2.5% in 2024.
- Compared to last month, forecasts for interest rates (10-year Treasury) have been lowered as recent weak economic data create uncertainty about the future path of Fed tightening.
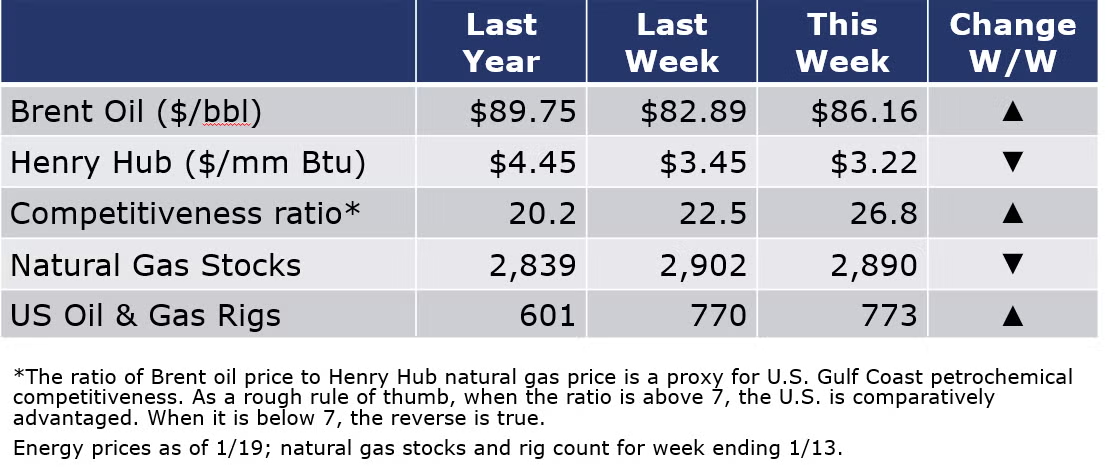
Oil prices were higher this week on optimism about a recovery in China, but U.S. natural gas prices continued to move lower, reflecting milder winter temperatures and likely, lower industrial demand. Natural gas prices were at the lowest level since mid-2021. The combined oil and gas rig count was up by three to 773 during the week ending 13 January.
For the business of chemistry, the indicators brings to mind a red banner for basic and specialty chemicals.
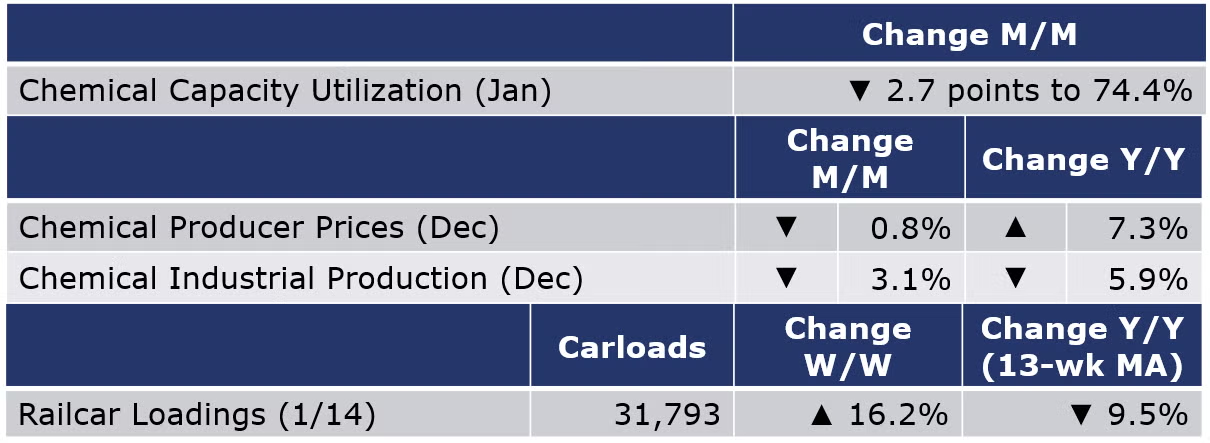
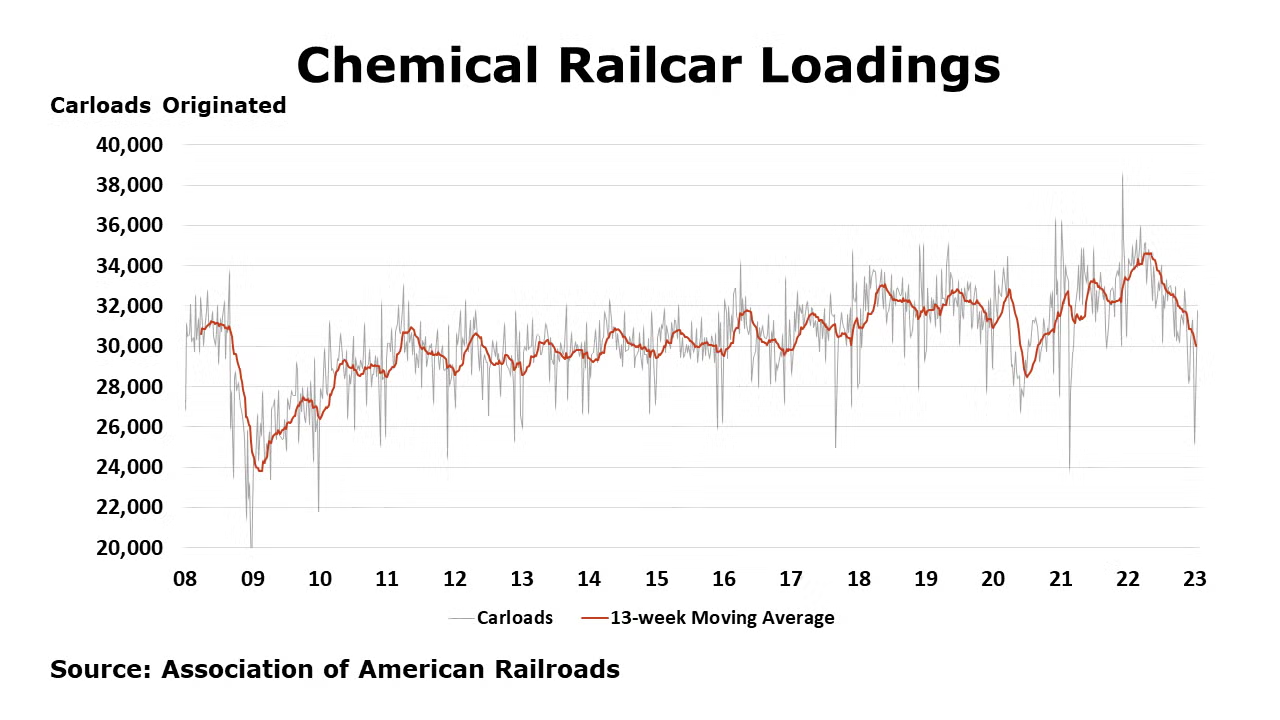
According to data released by the Association of American Railroads, chemical railcar loadings were up 4,437 to 31,793 for the week ending 14 January. Loadings were down 9.5% Y/Y (13-week MA) and have been on the rise for 8 of the last 13 weeks.
Chemical producer prices fell by 0.8% in December, the sixth consecutive monthly decline. Declining prices for bulk petrochemicals & organics, plastic resins, synthetic rubber, and manufactured fibers were only partially offset by higher prices for agricultural chemicals, consumer products, coatings, and other specialty chemicals. Prices for inorganic chemicals were flat in December. Compared to a year ago, chemical prices remained ahead by 7.3%. For all of 2022, chemical prices were up 15.5%.
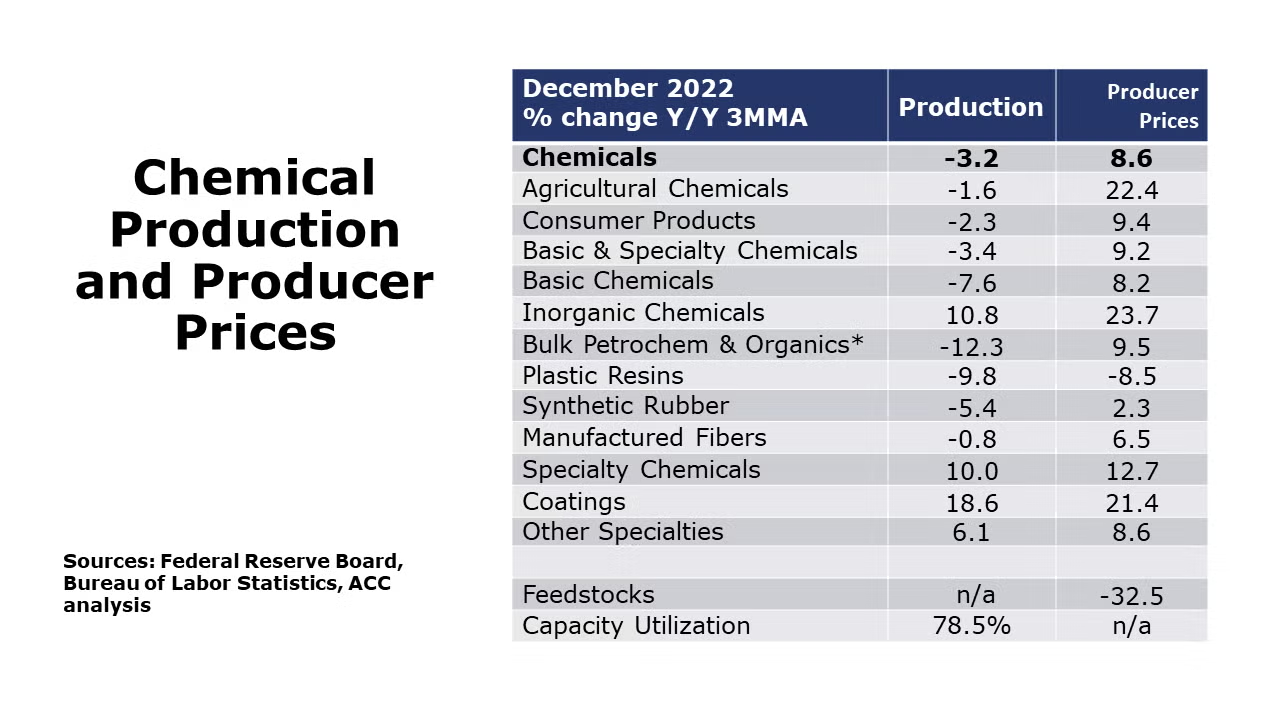
Chemical production fell sharply in December, down by 3.1%, reflecting a combination of weaker demand for chemicals and a pre-Christmas freeze that caused temporary shutdowns along the U.S. Gulf Coast. There were month-on-month declines across nearly all segments, except agricultural chemicals. Production was 5.9% lower than last December. Chemical capacity utilization fell 2.7 points to 74.4%, the lowest rate since Winter Storm Uri hit in February 2021.
Note On the Color Codes
The banner colors represent observations about the current conditions in the overall economy and the business chemistry. For the overall economy we keep a running tab of 20 indicators. The banner color for the macroeconomic section is determined as follows:
Green – 13 or more positives
Yellow – between 8 and 12 positives
Red – 7 or fewer positives
For the chemical industry there are fewer indicators available. As a result we rely upon judgment whether production in the industry (defined as chemicals excluding pharmaceuticals) has increased or decreased three consecutive months.
For More Information
ACC members can access additional data, economic analyses, presentations, outlooks, and weekly economic updates through MemberExchange.
In addition to this weekly report, ACC offers numerous other economic data that cover worldwide production, trade, shipments, inventories, price indices, energy, employment, investment, R&D, EH&S, financial performance measures, macroeconomic data, plus much more. To order, visit http://store.americanchemistry.com/.
Every effort has been made in the preparation of this weekly report to provide the best available information and analysis. However, neither the American Chemistry Council, nor any of its employees, agents or other assigns makes any warranty, expressed or implied, or assumes any liability or responsibility for any use, or the results of such use, of any information or data disclosed in this material.
Contact us at ACC_EconomicsDepartment@americanchemistry.com


