Running tab of macro indicators: 6 out of 20
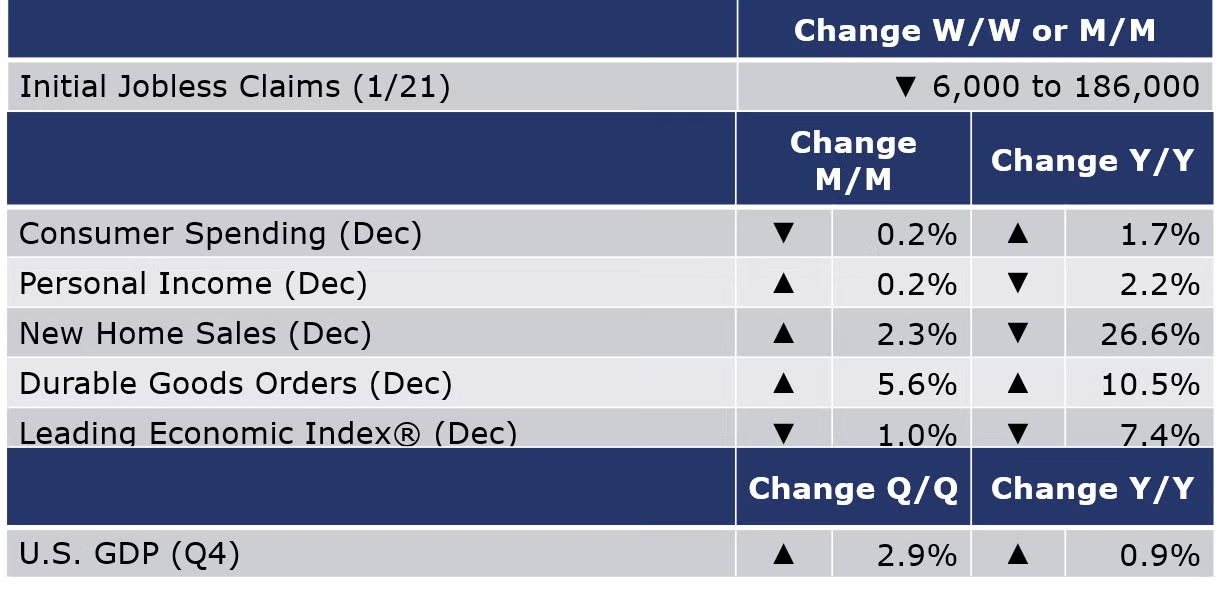
The number of new jobless claims fell by 6,000 to 186,000 during the week ending 21 January. Continuing claims increased by 20,000 to 1.67 million, and the insured unemployment rate for the week ending 14 January increased by 0.1 percentage point to 1.2%.
Consumer spending eased at the end of 2022 with a 0.2% decline in December. Spending on goods continued to decrease and spending on services, which had been on the rise since February, was flat. Personal income, the aggregate spending power of the economy, continued to expand, up 0.2%. The savings rate rose to its highest level since May at 3.4% as households face an uncertain future. Compared to a year ago (and adjusted for inflation), consumer spending was up 2.2% Y/Y while personal income remained off by 1.7%. With the removal of pandemic-related stimulus, income growth in 2022 lagged 2021. During 2022, much of the gain in consumer spending was financed by the savings accumulated during the pandemic. The annual growth in the price index for personal consumption expenditures (PCE) slowed to 5.0% in December from 5.5% in November. Stripping out the volatile food and energy components, the core PCE price index slowed to a 4.4% pace of growth (down from 4.7% in November). This is the inflation measure that the Fed is targeting to bring back down to 2%.

New home sales rose by 2.3% in December, following a revised November estimate, but remained 26.6% below the 2021 level. Sales were higher in the Midwest and South but fell in the Northeast and West. The inventory of unsold homes remained stable, resulting in the months’ supply falling from 9.2 months to 9.0 months. The median sales price rose by 7.8% Y/Y. An estimated 644,000 new home sales were sold in 2022, a level down 16.4% compared to the 2021 figure.

The Conference Board’s Leading Economic Index® (LEI) fell 1.0% in December, the 10th consecutive decline. The reading was more negative than expected and November’s decline was revised downward. Citing widespread weakness among leading indicators, the Conference Board noted that the reading continues “to signal recession for the US economy in the near term”. Resilient labor market indicators have kept the co-produced coincident and lagging indicators in positive territory, for the time being. The LEI was off 7.4% Y/Y.
New orders for manufactured durable goods were up 5.6% in December, the fourth increase in the past five months. Driving the increase were orders for transportation equipment (up 16.7% in December) which includes civilian aircraft which more than doubled. New orders for nondefense capital goods were up 19.2%; new orders for defense capital goods were down 2.8%. Core business orders (nondefense capital goods excluding aircraft) were down 0.2%. Overall, new orders were up 10.5% Y/Y. Unfilled orders, which indicate a backlog in production, were up 1.3% in December—the 28th consecutive monthly increase—and up 7.3% Y/Y.
The BEA reported Q4 GDP rose at a 2.9% seasonally adjusted annual rate (SAAR). The gain primarily reflected private inventory investment (led by petroleum, coal products, and chemicals), consumer spending (increases in both services and goods), federal government spending (led by nondefense spending), state and local government spending (increase in compensation of state and local government employees), and nonresidential fixed investment (increase in intellectual property products) that were partly offset by decreases in residential fixed investment (decrease in new single-family construction and brokers’ commissions) and exports (led by nondurable goods excluding petroleum). Imports, which are a subtraction in the calculation of GDP, decreased (led by durable consumer goods). On an annual basis, real GDP increased by 2.1% in 2022, reflecting increases in consumer spending, exports, private inventory investment, and nonresidential fixed investment that were partly offset by decreases in residential fixed investment and federal government spending.
SURVEY OF ECONOMIC FORECASTERS - GLOBAL
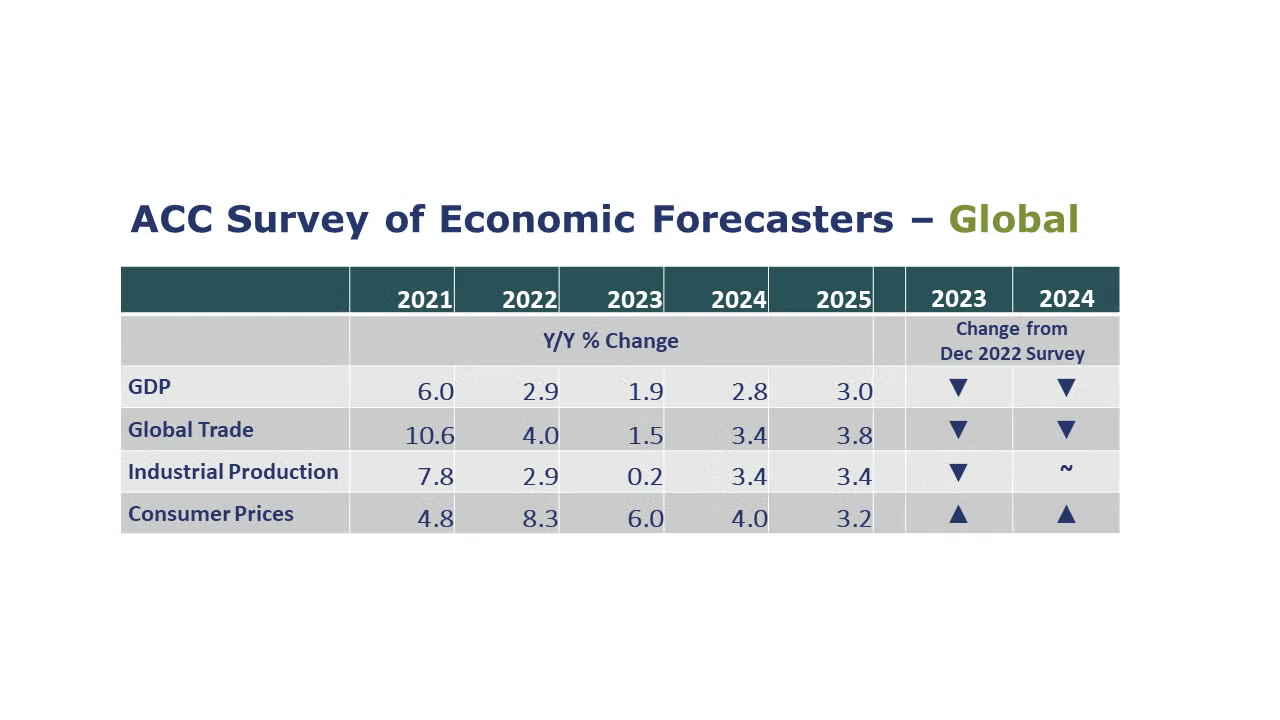
ACC’s survey of economic forecasters suggests global economic growth slowed to 2.9% in 2022. Forecasters downgraded their estimates for 2023-2024. Many of the world’s economies are expected to enter recession this year and global growth is forecast to decline to a pace just under 2% (about 1.9%) before improving to a 2.8% pace of growth in 2024. Energy, feedstock, inflationary and trade and supply chain related challenges have hampered manufacturing activity. Consumers’ shift back towards more typical (pre-pandemic) consumption patterns weakened industrial products demand. These have been some of the factors impacting industrial production. Forecasters estimate global industrial production expanded 2.9% last year and over the course of 2023, will expand just barely (about 0.2%) before rising 3.4% in 2024 and 2025. As economic growth is expected to deteriorate, the outlook for trade expansion has been downgraded. World trade will slow to a 1.5% gain this year and then grow 3.4% in 2024 and 3.8% in 2025. After rising to an 8.3% pace in 2022, global inflation is expected to remain uncomfortably high through 2023 (estimated 6.0%) before moderating to 4.0% in 2024 and 3.2% in 2025.
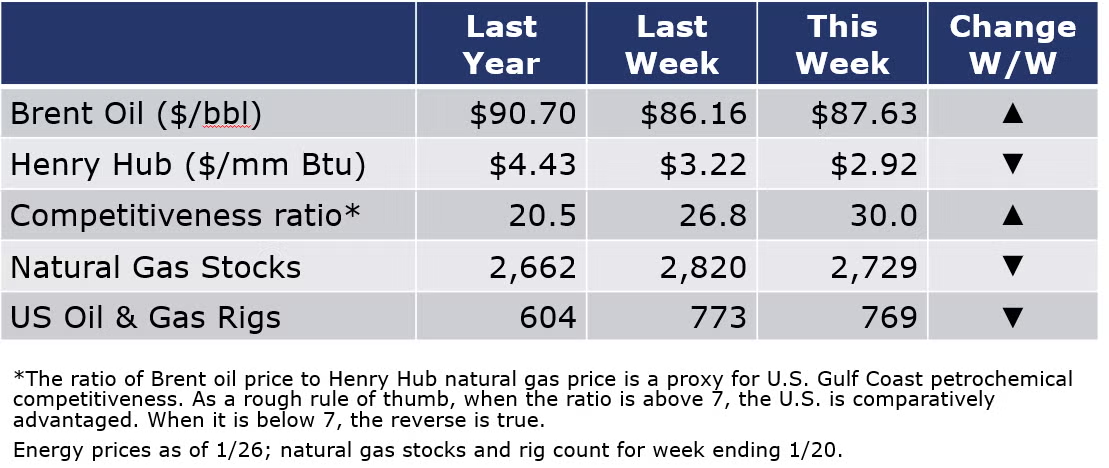
With a combination of weaker demand (mild weather and an industrial recession) and production gains, U.S. natural gas prices continued to decline, hitting their lowest level in nearly 2 years (April 2021). Oil prices were higher this week on some better-than-expected economic news and a smaller-than-expected inventory build. The combined oil and gas rig count fell by four to 769 during the week ending 20 January.
For the business of chemistry, the indicators brings to mind a red banner for basic and specialty chemicals.

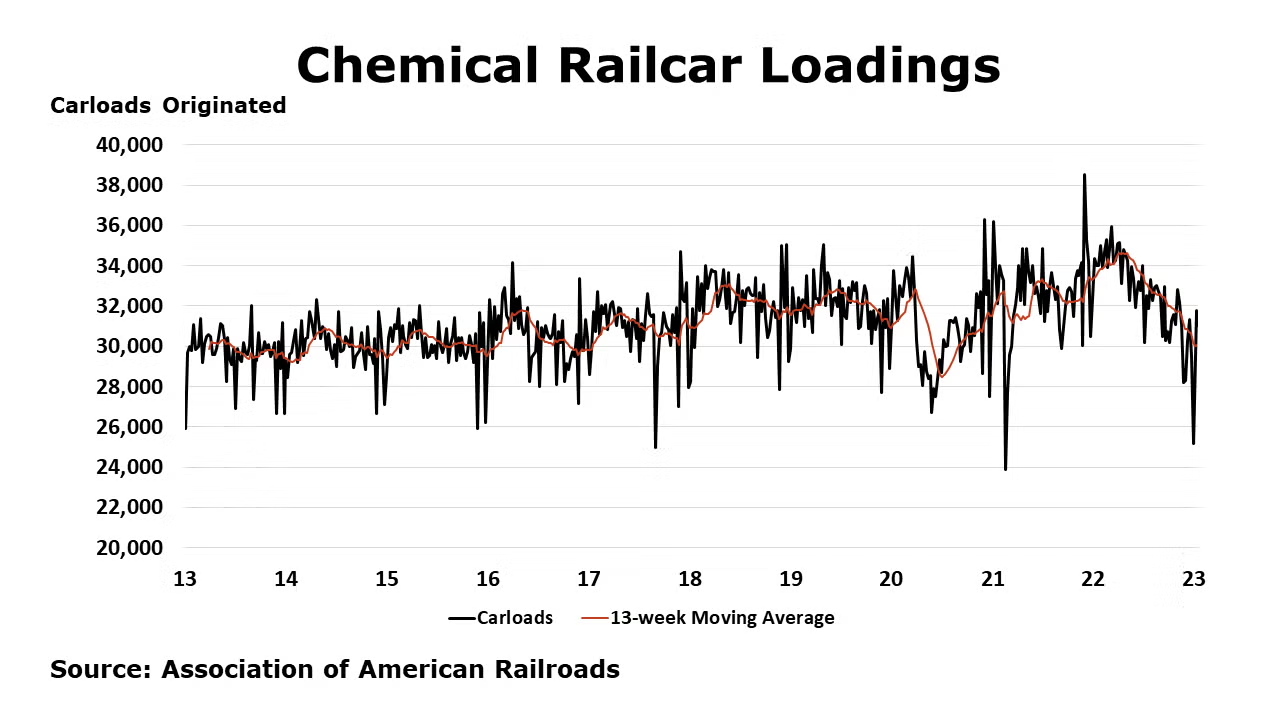
According to data released by the Association of American Railroads, chemical railcar loadings were down to 31,038 for the week ending January 21. Loadings were down 9.6% Y/Y (13-week MA), down (11.9%) YTD/YTD and have been on the rise for 8 of the last 13 weeks.
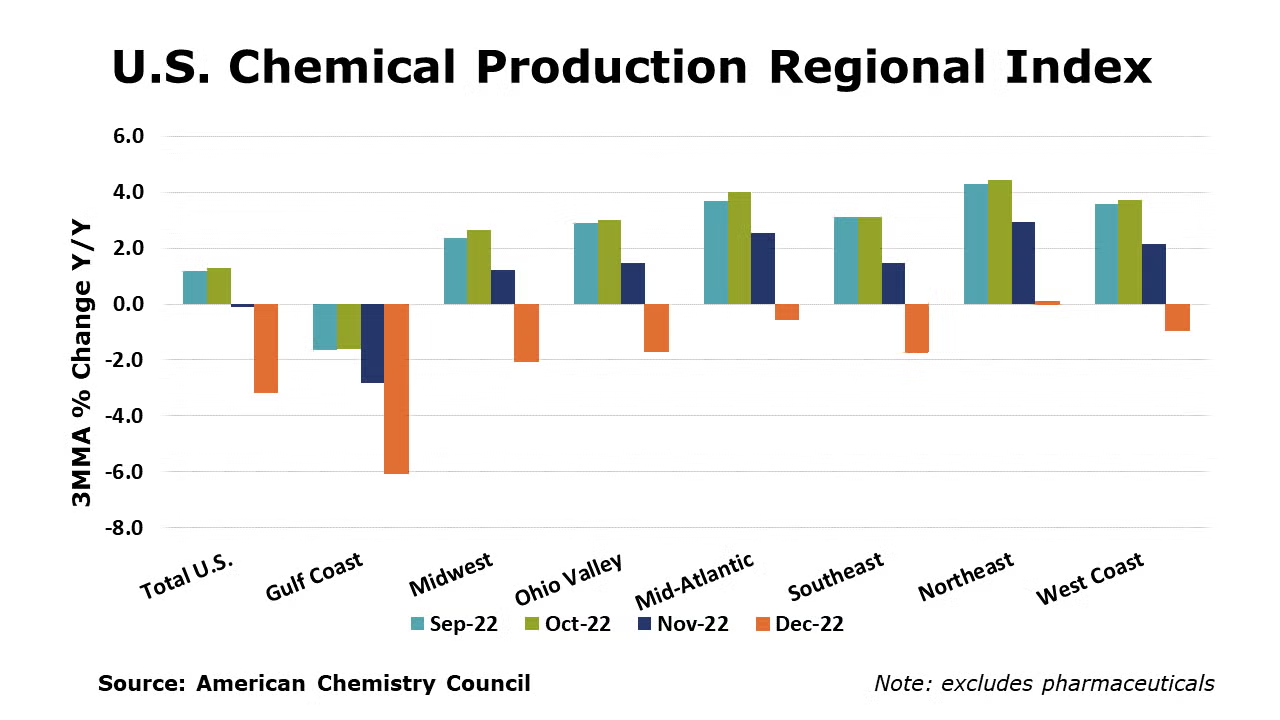
The U.S. Chemical Production Regional Index (U.S. CPRI) fell by 1.5% in December following declines of 0.3% in October and 0.8% in November. Chemical output was lower than a month ago in all regions, with the largest declines in the Gulf Coast, home to much of the nation’s basic industrial chemical and synthetic materials capacity. The declines reflect not only, declining output across multiple key end-use industries and weak export markets, but also disruptions from winter storm Elliott that hit in late December. Many chemical facilities along the U.S. Gulf Coast shut down in preparation of the freezing temperatures.
The U.S. CPRI is measured as a three-month moving average (3MMA) and was developed by ACC to track chemical production activity in seven regions of the United States.
On a 3MMA basis, chemical production within segments was mostly negative in December. Only fertilizer output was higher. Production in all other segments was down compared to a month earlier.
As nearly all manufactured goods are produced using chemistry in some form, manufacturing activity is an important indicator for chemical demand. Following a decline of 0.2% in November, manufacturing output was down 0.7% in December on a 3MMA basis. The 3MMA trend in manufacturing production was mixed, with many segments contracting. Output continued to expand, however, in motor vehicles, aerospace, appliances, food & beverages, printing, and apparel.
Compared with December 2021, U.S. chemical production was 3.2% lower. Chemical production was lower than a year ago in all regions, except the Northeast. The steepest decline was in the Gulf Coast.
Note On the Color Codes
The banner colors represent observations about the current conditions in the overall economy and the business chemistry. For the overall economy we keep a running tab of 20 indicators. The banner color for the macroeconomic section is determined as follows:
Green – 13 or more positives
Yellow – between 8 and 12 positives
Red – 7 or fewer positives
For the chemical industry there are fewer indicators available. As a result we rely upon judgment whether production in the industry (defined as chemicals excluding pharmaceuticals) has increased or decreased three consecutive months.
For More Information
ACC members can access additional data, economic analyses, presentations, outlooks, and weekly economic updates through MemberExchange.
In addition to this weekly report, ACC offers numerous other economic data that cover worldwide production, trade, shipments, inventories, price indices, energy, employment, investment, R&D, EH&S, financial performance measures, macroeconomic data, plus much more. To order, visit http://store.americanchemistry.com/.
Every effort has been made in the preparation of this weekly report to provide the best available information and analysis. However, neither the American Chemistry Council, nor any of its employees, agents or other assigns makes any warranty, expressed or implied, or assumes any liability or responsibility for any use, or the results of such use, of any information or data disclosed in this material.
Contact us at ACC_EconomicsDepartment@americanchemistry.com

