Running tab of macro indicators: 7 out of 20
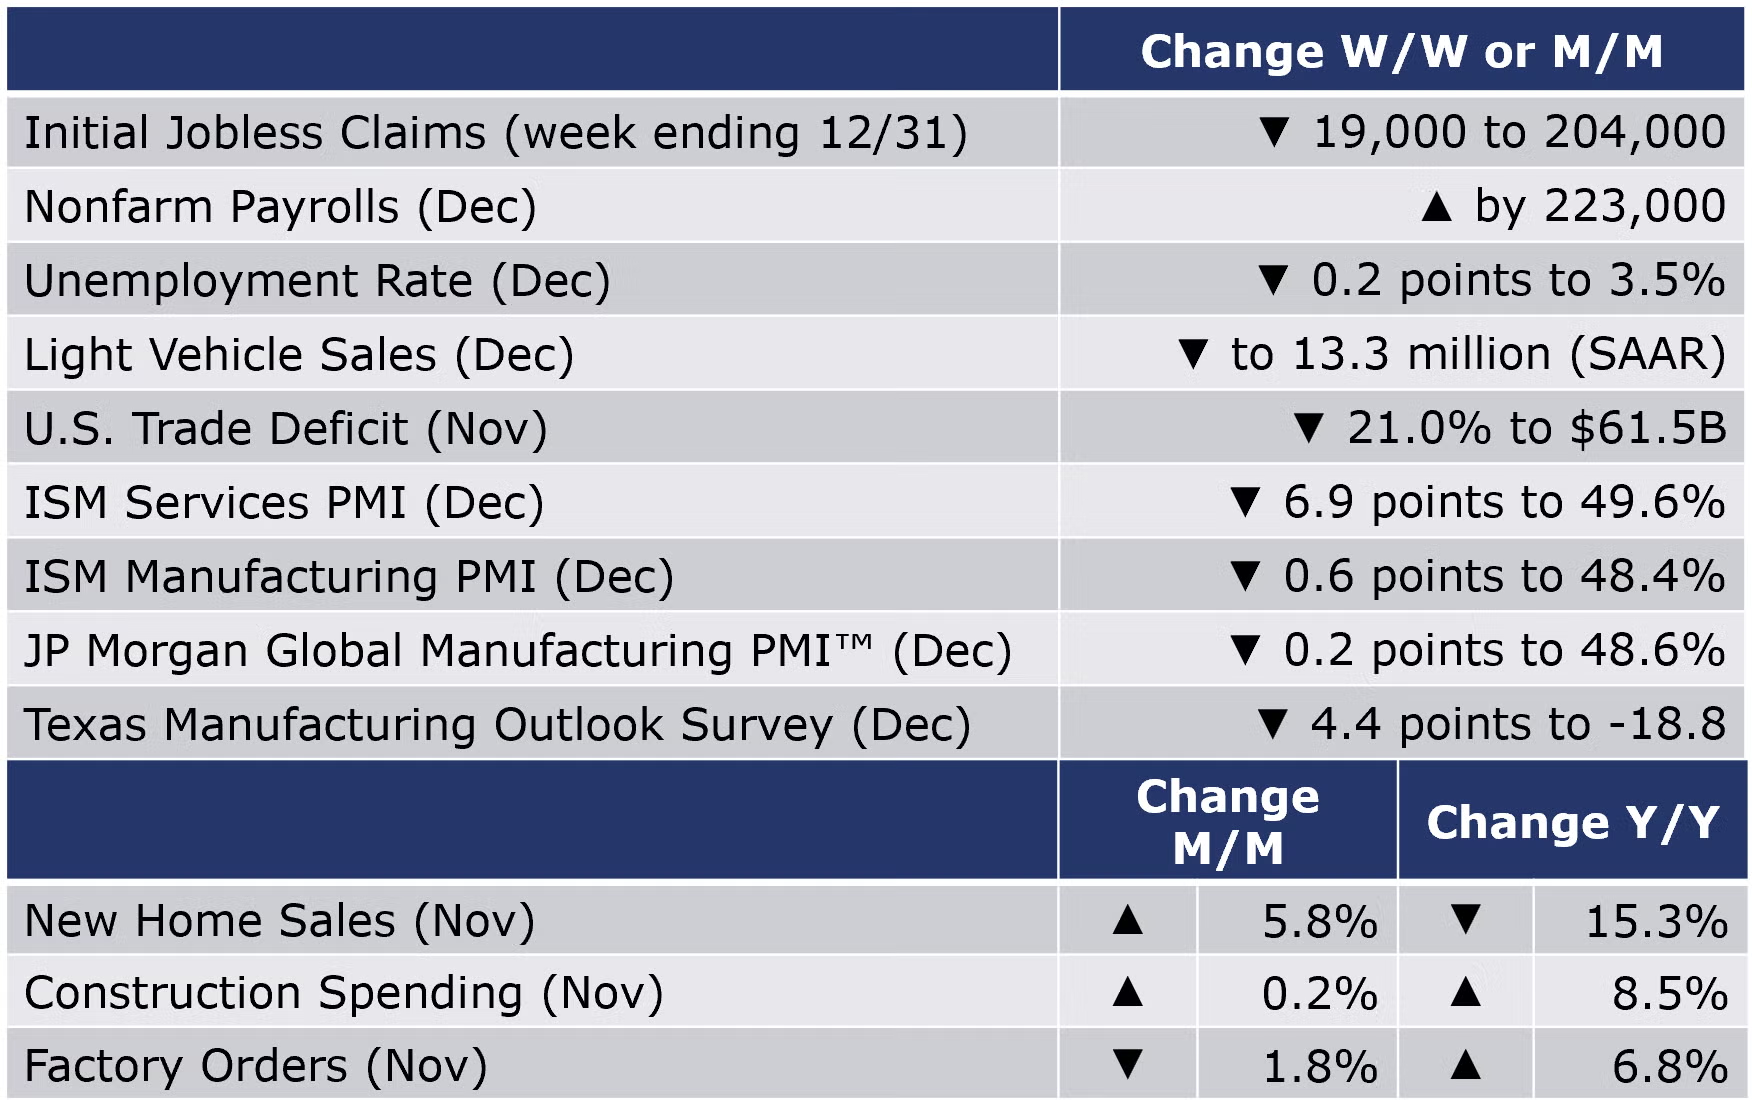
Growth in nonfarm payrolls decelerated in December but continued to expand into the end of the year with a higher-than-expected gain of 223,000. Employment in temporary help services, a good leading indicator of employment trends, continued to contract. Wage growth slowed to 4.6% Y/Y for all employees and 5.0% Y/Y for production workers. Average weekly hours also fell back, another sign that labor demand is cooling. The unemployment rate fell back to its 50-year low of 3.5% as new entrants into the labor force were quickly absorbed into the ranks of the employed and the number of unemployed people also fell.
The number of new jobless claims was down by 19,000 to 204,000 during the week ending 31 December. Continued claims were down (by 24,000) to 1.69 million for the week ending 24 December and the insured unemployment rate was 1.2%, unchanged from the previous week's revised rate.
The labor market remained tight heading into the end of the year. Job openings eased only slightly in November from October’s upwardly revised level. The deficit of available workers (labor force) to fill the number jobs available in the economy (employment + job openings) remained at an historically high 4.4 million. There remain 1.7 job openings to every unemployed person looking for work (compared to an average of 0.6 openings between 2001-19).
The U.S. trade deficit decreased in November by 21.0% to $61.5 billion as imports fell 6.4% and exports fell 2.0%. Imports of goods were down notably in many categories including consumer goods (pharma, cell phones and other household goods), industrial supplies and materials (crude oil), autos and parts, and capital goods (computers and telecoms equipment). U.S. goods exports are down as the high dollar and economic deterioration abroad weaken demand. Exports were down in industrial supplies and materials (natural gas, nonmonetary gold, crude oil), capital goods, and consumer goods (pharma).
The ISM Services PMI fell by 6.9 points in December to 49.6%. The reading below 50 suggests that the services sector contracted for the first time since the pandemic lockdowns. While business activity/production continued to expand, there were contractions in new orders, inventories, new export orders, and employment. Inventory sentiment shifted from “too low” to “too high” suggesting some involuntary inventory accumulation in some parts of the supply chain.
New home sales unexpectedly rose in November, up by 5.8%, but the gain comes after downwardly revised estimates for the previous several months. Inventories continued to edge lower and represent an 8.6-month supply, lower than the previous two months, but up from 6.2 months in November 2021. Sales were off 15.3% compared to a year ago. The median sales price was up 9.5% from last November but edged down compared to October 2022.
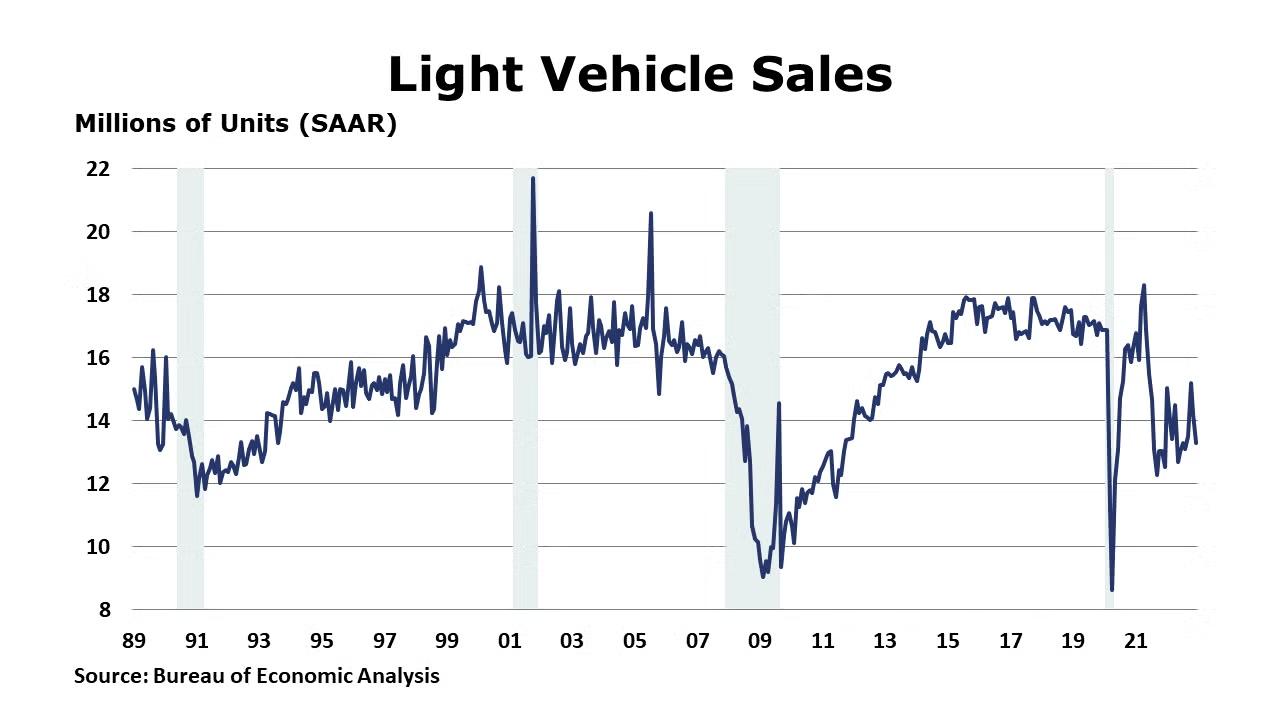
Light vehicle sales eased to a 13.3 million seasonally adjusted annual rate (SAAR) in December, down from 14.2 million SAAR in November and 15.2 in October. The rising cost of borrowing may be tempering demand for vehicles. With December’s data in hand, vehicle sales for the year came in at 13.8 million, the lowest level since 2009.
Construction spending rose 0.2% in November and was up 85% Y/Y. A 0.9% gain in nonresidential construction offset a 0.5% drop in residential. Spending on multi-family home construction rose 2.4% while spending on single family home construction fell 2.9%. Higher non-residential spending was led by a 6.4% gain in manufacturing which was up 42.9% Y/Y. Public spending on construction fell by 0.1% but was 10.4% higher Y/Y.
Factory orders fell by a larger-than-expected 1.8% in November following gains the previous three months. The decline was led by a steep fall in aircraft orders which are characteristically volatile. Beyond aircraft, orders for several other categories of durable goods were also lower. Nondurable orders were 1.4% lower. Core business orders edged higher by 0.1%, reflecting higher orders in some categories of machinery, metals, and electronics. The pipeline of unfilled orders was flat, following more than two years of expansion. Manufacturing shipments were down 0.6% and inventory growth was flat. The ratio of inventories-to-shipments ticked higher from 1.46 in October to 1.47 in November. This was still below the ratio of 1.50 last November. It seems clear that the momentum in manufacturing has played out and the sector was declining at the end of the year.
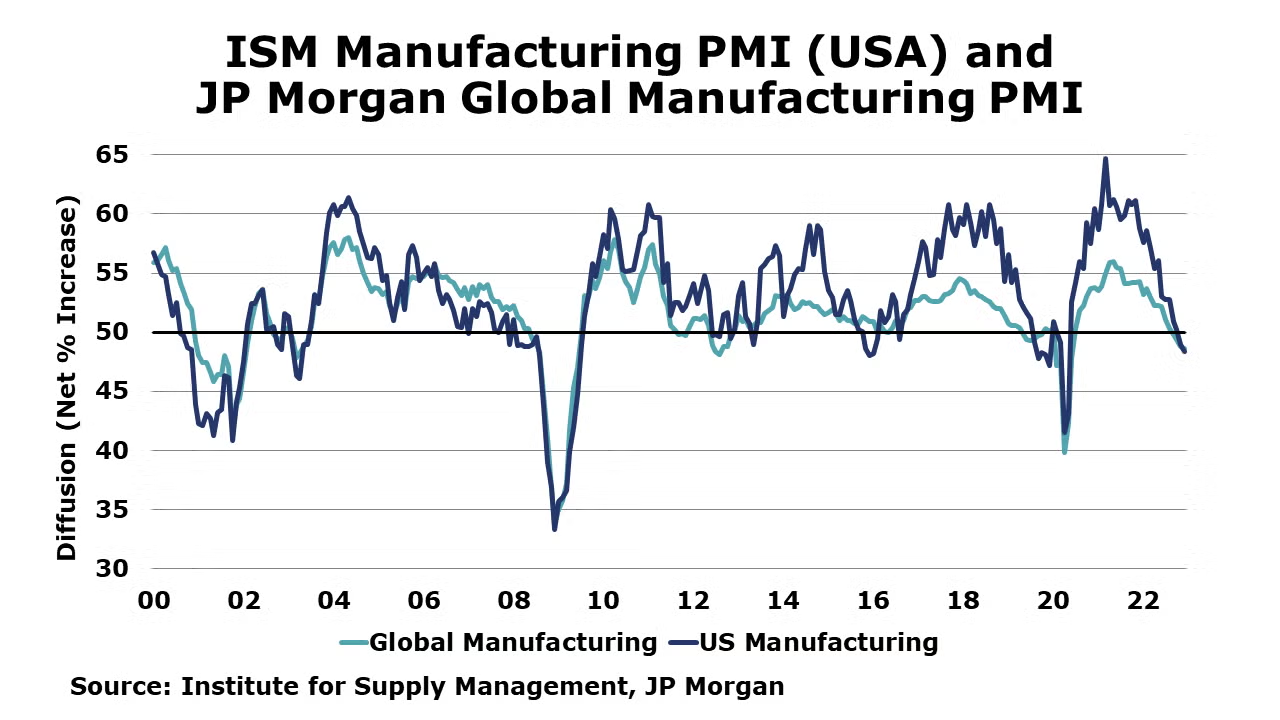
The ISM Manufacturing PMI® reading was under the 50-mark for the second month in a row. The PMI fell 0.6 points to 48.4% in December. This two-month period of contraction was preceded by 29 months of expansion in the U.S. industrial sector. Domestic and external demand has been weakening and at a faster pace. Output dropped into contraction in December while employment pulled above the 50-mark to signal growth. Inventories expanded at a faster rate. Inflationary pressures ease. Supply chain pressures are easing as well with faster supplier deliveries being reported. Just two manufacturing industries reported growth in December while 13 industries were contracting.
The JP Morgan Global Manufacturing PMI™ reading was 0.2 points lower at 48.6% in December. It was the fourth month in a row with a reading below 50, indicating sustained deterioration through the latter part of the year. Output continued to decline in December but at a slower rate. Looking at the sector breakdown, the drag is in intermediate goods. Output in consumer and investment goods rose. Demand is weakening. New goods orders were down across all three sectors, however. New export orders declined, as well. Manufacturing jobs decreased for the second month in a row. Twenty-two of 29 countries with data had PMI readings indicating contraction in their manufacturing sector.
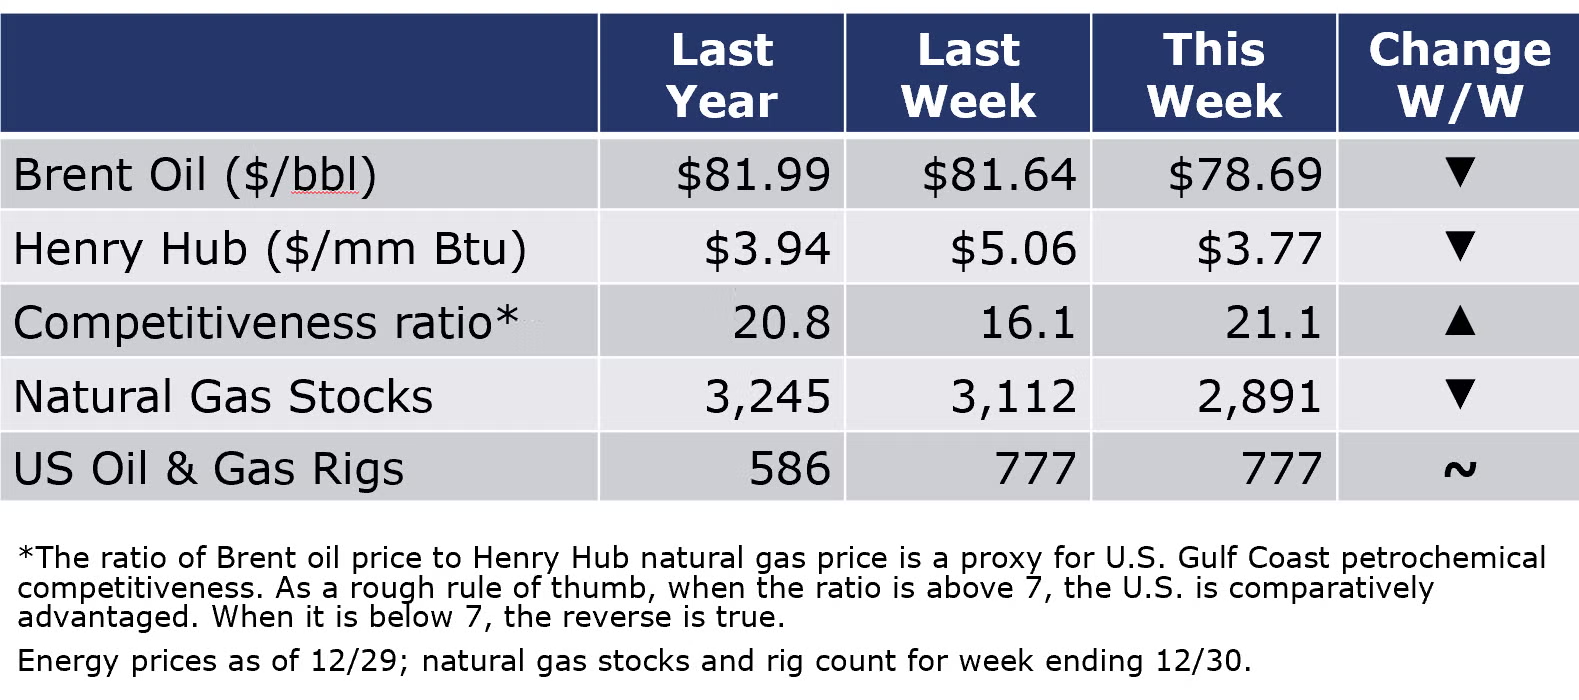
Oil prices were lower on growing concerns about the global economy. Natural gas prices fell to below $4/mmbtu (the lowest in a year) as unseasonably warm temperatures are forecast to continue. The combined oil and gas rig count remained steady at 777 during the week ending 30 December.
For the business of chemistry, the indicators still bring to mind a red banner for basic and specialty chemicals.
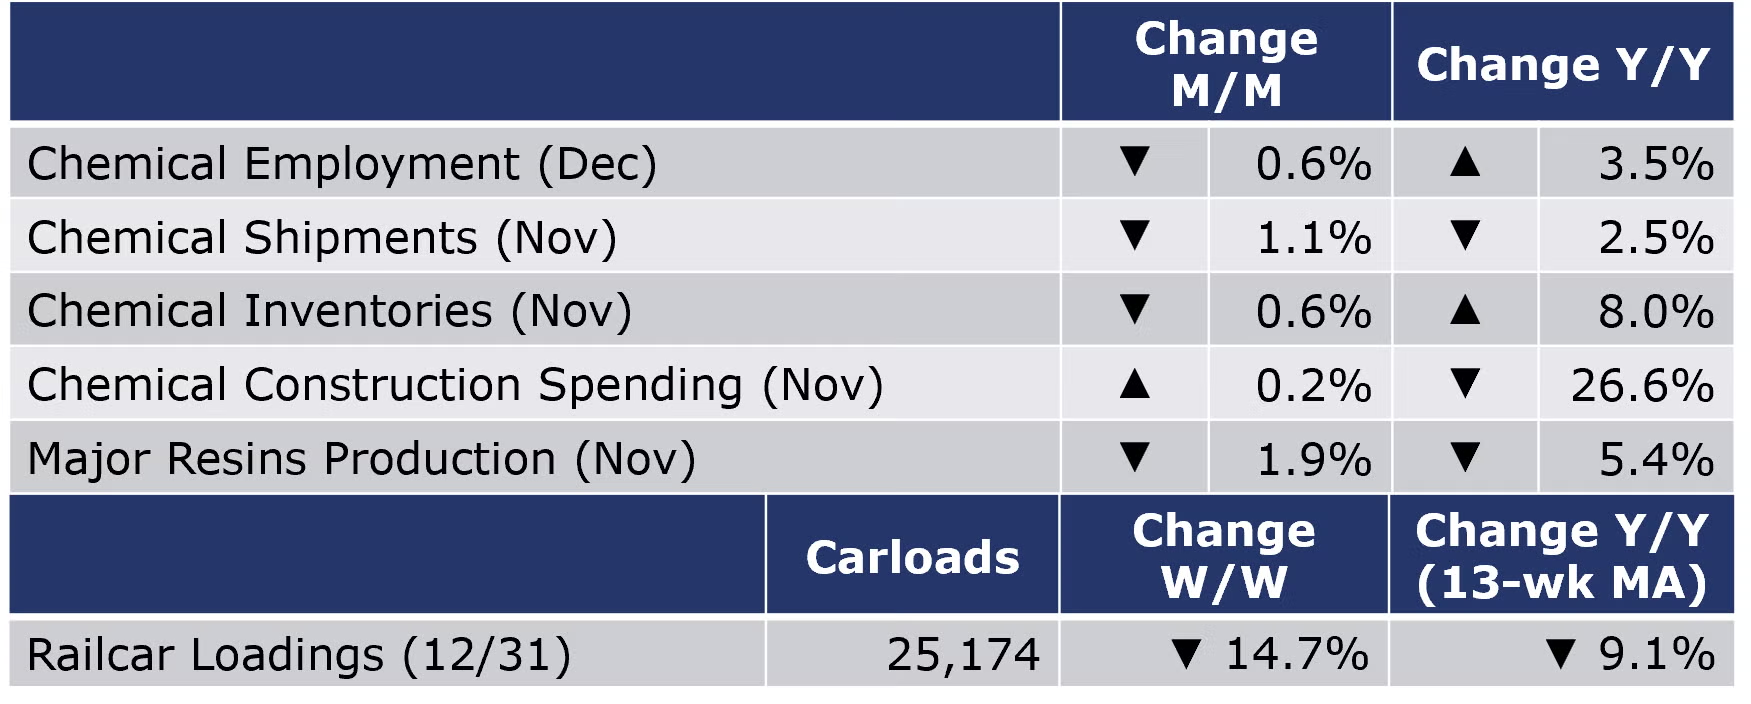
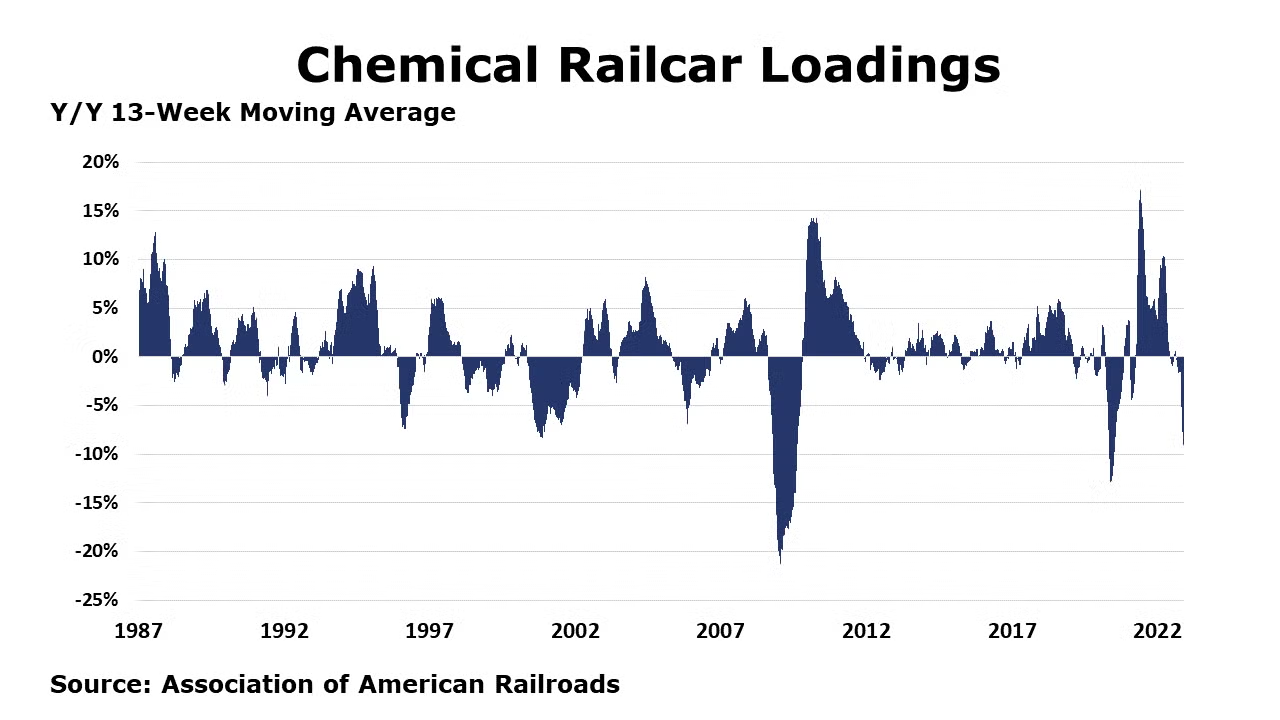
According to data released by the Association of American Railroads, chemical railcar loadings fell over the last two weeks of 2022 to 25,174 for the week ending 31 December. Loadings were down 9.1% Y/Y (13-week MA), flat YTD/YTD and have been on the rise for six of the last 13 weeks.
Within the details of the ISM report, the chemical industry was reported to have contracted in December. There were contractions in inventories, new orders and new export orders, and production in December, but chemical products customers’ inventories were reported as being “too low” which bodes well for future production. There was no change in employment in December compared to November. Supplier deliveries were faster and inflationary pressures on raw materials eased. One chemical industry respondent noted that “Customer demand continues to be depressed. While 2023 pipeline is looking very positive, current demand is significantly down”.
Chemical industry employment (including pharmaceuticals) fell by 5,700 (0.6%) in December with a small gain in the number of production workers that was more than offset by a large decline in supervisory/non-production jobs. Compared to a year ago, chemical industry employment was higher by 31,000 (3.5%). Average hourly wages for production workers were up 5.1% Y/Y, a slower pace than November’s upwardly revised 6.2% pace of wage gains. The average workweek for chemical industry workers rose by 6 minutes in December to 41.3 hours and the total labor input into the chemical industry was higher by 0.3% in December, in contrast again with the ISM report that suggested that the chemical industry output contracted.
Chemical industry construction spending edged up (by 0.2%) in November. Compared to a year ago, chemical construction spending was off by 26.6%. Chemical construction spending as a percent of total manufacturing construction spending was 19.3% in November. The comparison has been softening gradually after climbing to then sustaining a high proportion around 46% during 2014-2017.

U.S. production of major plastic resins totaled 7.2 billion pounds during November 2022, down 1.9% compared to the previous month, and down 5.4% Y/Y, according to ACC statistics. Year-to-date production was 85.3 billion pounds, up 2.6% Y/Y. Sales and captive use of major plastic resins increased 1.5% from October to 7.5 billion pounds and were down slightly (0.6%) Y/Y. Year-to-date sales were 85.1 billion pounds, up 4.2% Y/Y.
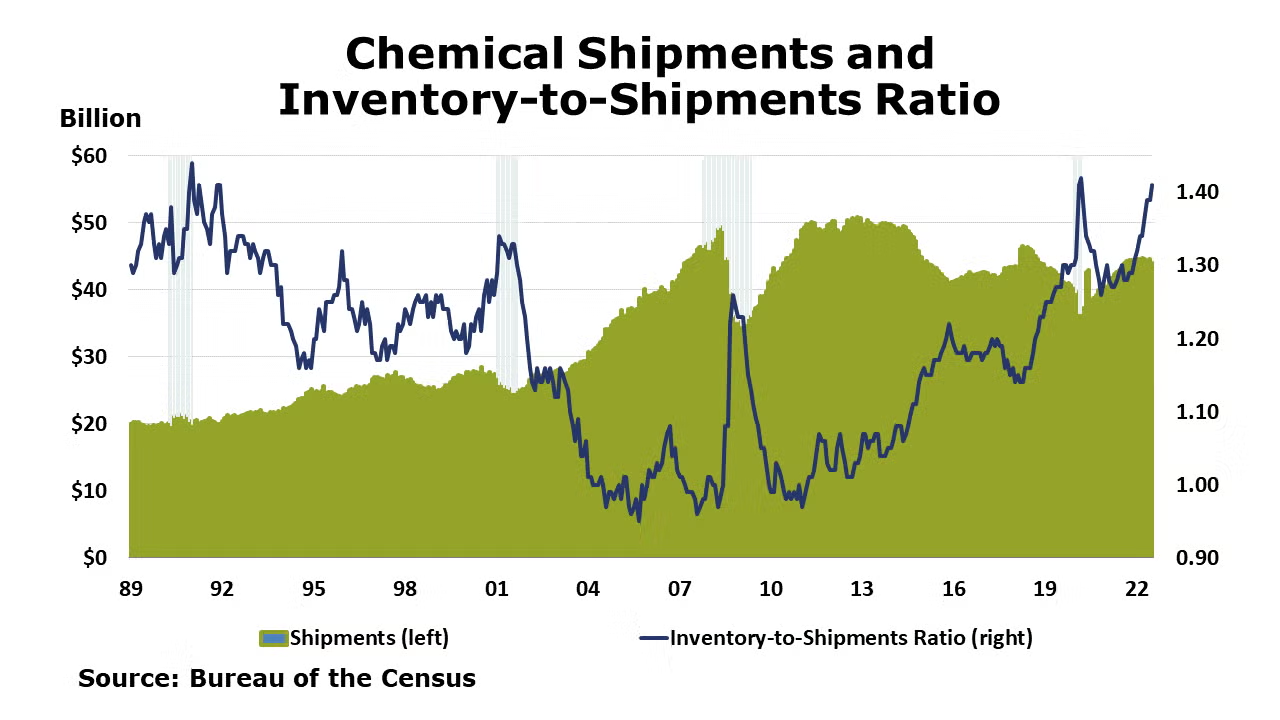
Chemical shipments continued to deflate in November, down by 1.1%. There were declines across all major categories. Chemical inventories also fell, down by 0.6%. Higher inventories of coatings and adhesives were offset by lower inventories of agricultural and other chemicals. As shipments fell faster than inventories, the inventories-to-shipments ratio moved higher from 1.41 in October to 1.42 in November. This was up from last November when the ratio was 1.28. Compared to a year ago, chemical shipments were off 2.5% while inventories were up 8.0%.
Note On the Color Codes
The banner colors represent observations about the current conditions in the overall economy and the business chemistry. For the overall economy we keep a running tab of 20 indicators. The banner color for the macroeconomic section is determined as follows:
Green – 13 or more positives
Yellow – between 8 and 12 positives
Red – 7 or fewer positives
For the chemical industry there are fewer indicators available. As a result we rely upon judgment whether production in the industry (defined as chemicals excluding pharmaceuticals) has increased or decreased three consecutive months.
For More Information
ACC members can access additional data, economic analyses, presentations, outlooks, and weekly economic updates through MemberExchange.
In addition to this weekly report, ACC offers numerous other economic data that cover worldwide production, trade, shipments, inventories, price indices, energy, employment, investment, R&D, EH&S, financial performance measures, macroeconomic data, plus much more. To order, visit http://store.americanchemistry.com/.
Every effort has been made in the preparation of this weekly report to provide the best available information and analysis. However, neither the American Chemistry Council, nor any of its employees, agents or other assigns makes any warranty, expressed or implied, or assumes any liability or responsibility for any use, or the results of such use, of any information or data disclosed in this material.
Contact us at ACC_EconomicsDepartment@americanchemistry.com

