Running tab of macro indicators: 7 out of 20
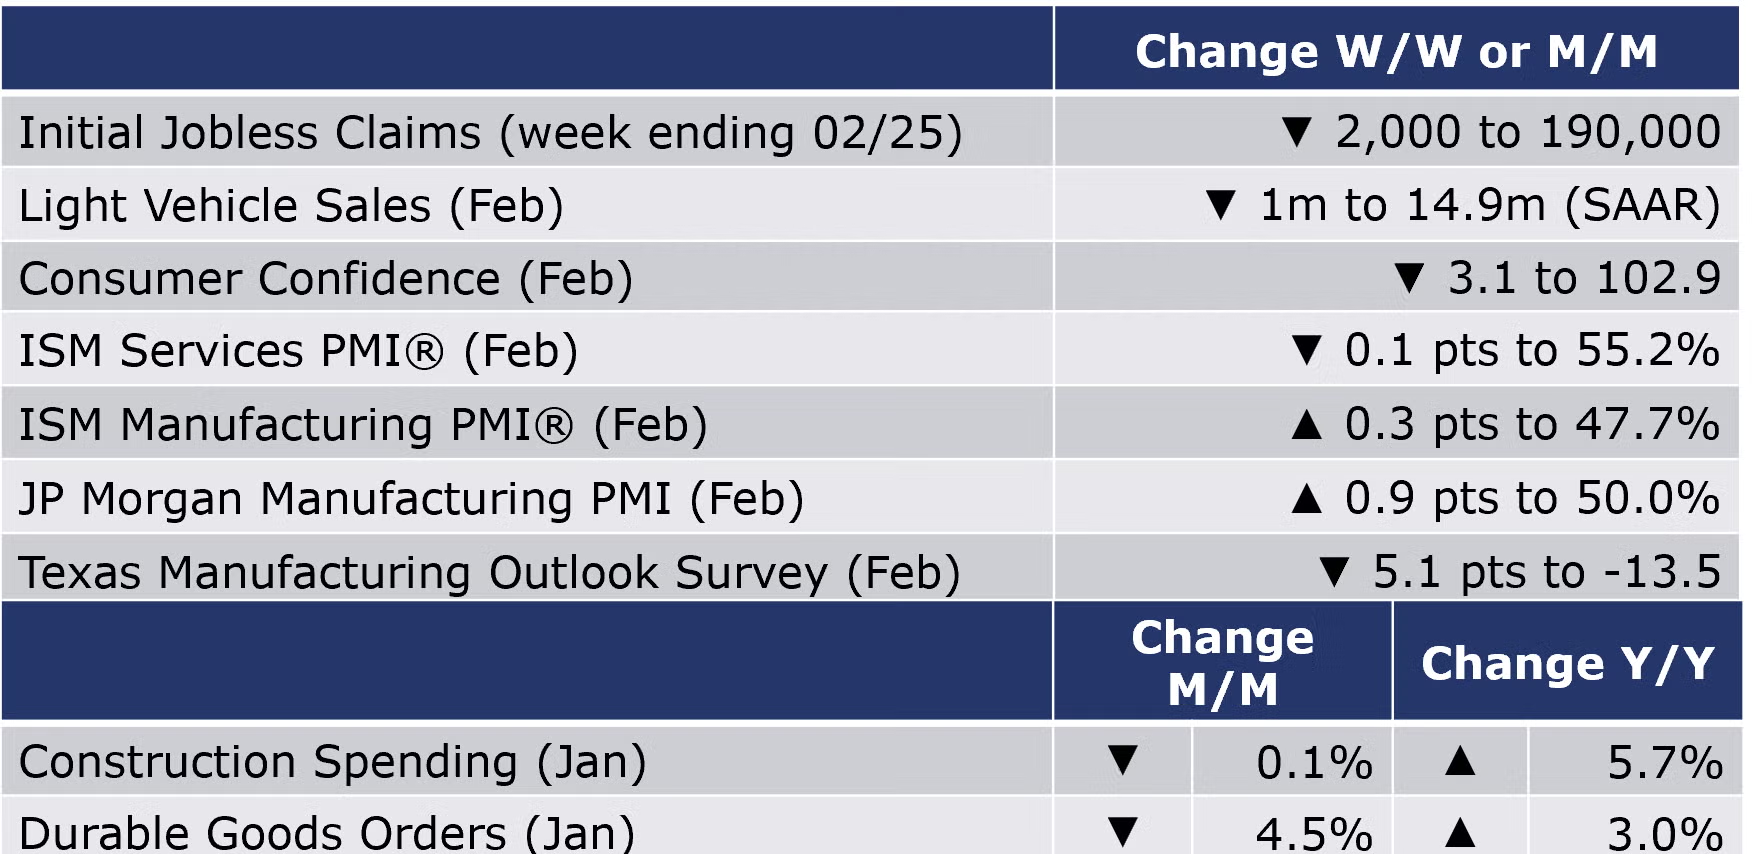
The number of new jobless claims fell by 2,000 to 190,000 during the week ending February 25. Continuing claims fell by 5,000 to 1.655 million, and the insured unemployment rate for the week ending February 25 was unchanged at 1.1%.
The Conference Board Consumer Confidence Index® fell to 102.9 in February (from 106.0 in January, which was revised downward). Consumers’ assessment of present economic and labor market conditions increased. However, consumer expectations retreated in February, reflecting their concerns about the economy over the next six months. Notably, the expectations index was below 80 (as it has been for the 11 of the last 12 months), which often signals a recession within the next year as consumers were less upbeat about business conditions, jobs and income prospects in the coming six months. Fewer consumers indicated they would buy a new home, auto, or appliance in the short-term.
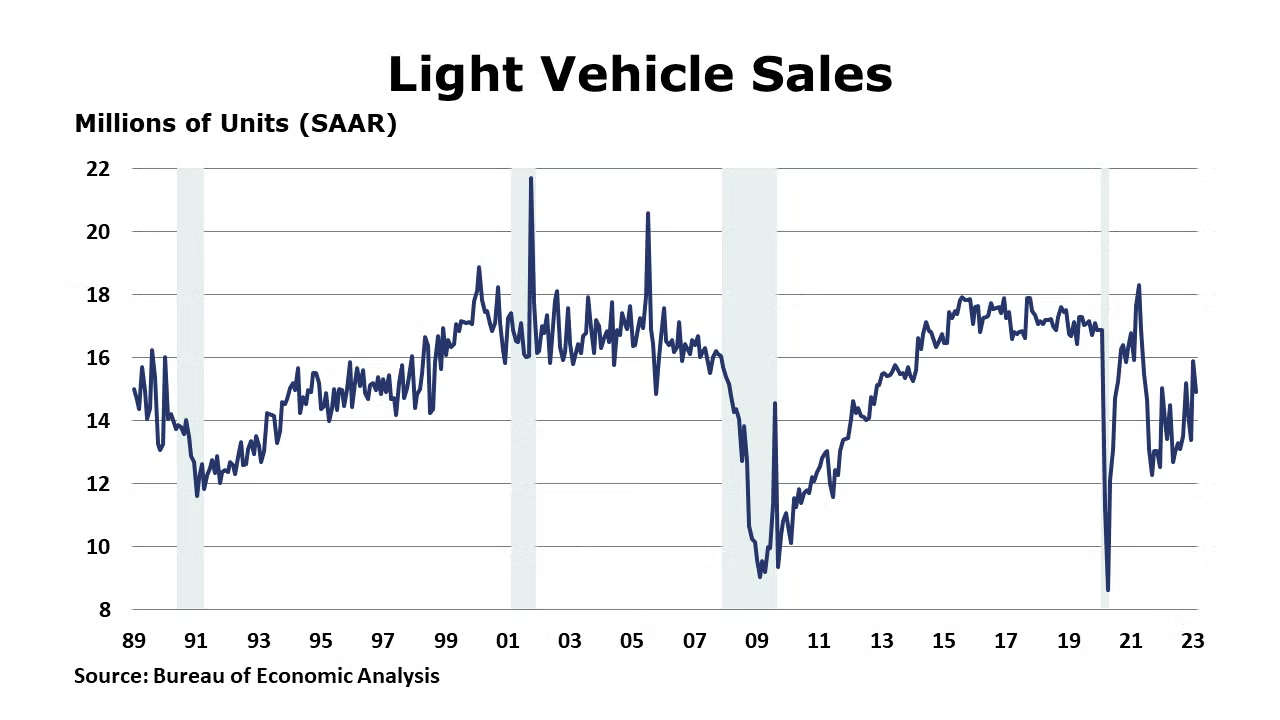
Light vehicle sales declined to 14.9 million units seasonally adjusted annual rate (SAAR), in February after a small upward revision to 15.9 million (previously 15.7 units). Sales of both domestically produced and imported vehicles were lower. While the short supply of new motor vehicles in 2022 has been largely alleviated, higher interest rates on car loans may continue to dampen demand.
Construction spending declined 0.1% in January but was up 5.7% Y/Y. A 0.6% decline in residential construction was partially offset by a 0.9% increase in nonresidential. Spending on multi-family home construction rose 0.4% while spending on single family home construction fell 1.7%. Higher non-residential spending was influenced by a 6.0% increase in manufacturing which was up 53.8% Y/Y. Public spending on construction fell by 0.6% but was 11.1% higher Y/Y.
Headline durable orders fell by 4.5% in January following a 5.1% gain in December. Excluding transportation (including the very volatile civilian aircraft component), orders were up 0.7% with gains across a broad set of industries. Orders for core business investment goods (nondefense capital goods, excluding aircraft) were up 0.8% following a 0.3% decline in January. Durable orders were up 3.0% Y/Y while core business orders were up 5.4% Y/Y.
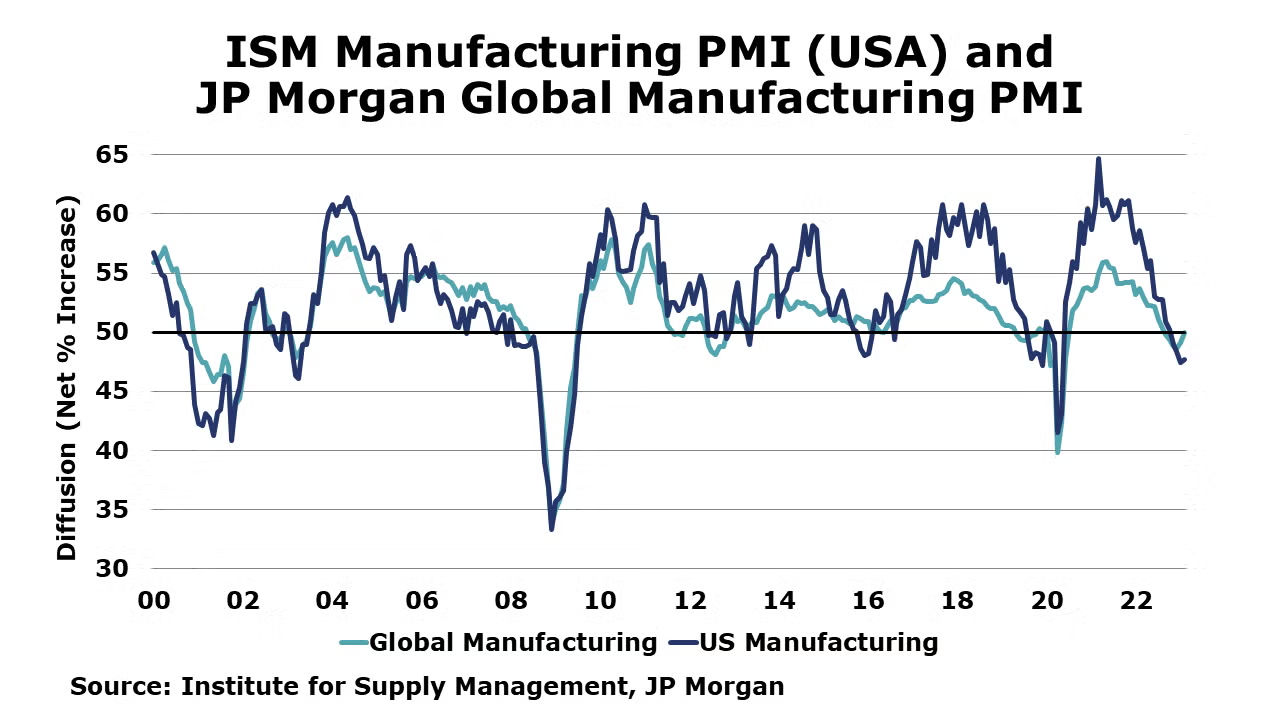
The ISM Manufacturing PMI® edged higher by 0.3 points to 47.7% in February, suggesting that U.S. manufacturing activity continued to contract for a fourth consecutive month, though at a slower pace than in January. A reading below 50% suggests contraction while a reading above 50% suggests expansion. Fourteen of the 18 industries covered reported contraction in February. Production contracted at a faster rate, but new orders fell at a slower pace. Manufacturing employment, which has grown steadily over the past several years, contracted. Raw materials inventories were modestly higher and customer inventories were deemed “too low”. Supplier deliveries were faster for a fifth straight month, reflecting easing supply chain pressures.
Following five months of contraction, the JP Morgan Global Manufacturing PMI rose 0.9 points to 50.0% in February. The neutral mark of 50% suggests that manufacturing on a global level remained stable. Output rose for the first time in seven months amid improving supply chains and China's re-opening. Solid growth in consumer and investment goods sectors offset the continued downturn in intermediate goods production. Benefiting from expansion in China, the upturn in production volumes was led by Asia, with Thailand, India and the Philippines registering the fastest rates of growth. Manufacturing continued to contract in Europe, UK, US, and Brazil. Business optimism also revived, rising to its highest level in a year. Input cost inflation eased to a 28-month low.
Texas factory activity declined in February for the first time since May 2020, according to business executives responding to the Dallas Fed’s Texas Manufacturing Outlook Survey. The production index, a key measure of state manufacturing conditions, edged down from 0.2 to -2.8, a reading suggestive of a modest contraction in output. New orders contracted for a ninth month in a row and the growth rate of orders fell at an accelerated pace. Pessimism about broader economic conditions worsened in February. The overall general business activity index fell from -8.4 in January to -13.5 in February.
The ISM Services PMI was 0.1 points lower in February at 55.2%, indicating the U.S. services sector continues to expand at a roughly stable pace. Except for a contraction in December, services have grown 32 of the last 33 months. The report for February indicates business activity is expanding (though a bit slower pace), employment picked up, orders are growing, supplier deliveries are faster and inflationary pressures remain but, are moderating somewhat.
ACC SURVEY OF ECONOMIC FORECASTERS
- The outlook for 2023 has improved for several indicators as we move into the end of Q1. While the balance of risks continues to suggest a mild recession in the U.S., a “soft landing” remains possible.
- Expectations for 2024, however, continue to deteriorate with ongoing weakness in consumer spending and business investment.
- U.S. GDP is expected to grow by a modest 0.6% in 2023 before expanding by a below-trend 1.4% in 2024.
- Consumer spending growth is expected to slow to a 0.9% Y/Y pace in 2023 before rising by 1.0% in 2024.
- Business investment is expected to grow modestly, by 0.8% in 2023 and 0.9% in 2024.
- The deterioration in industrial production, that began in late-2022 is expected to continue through mid-year before recovering. In 2023, industrial production is expected to contract by 1.4% and grow only 0.6% in 2024.
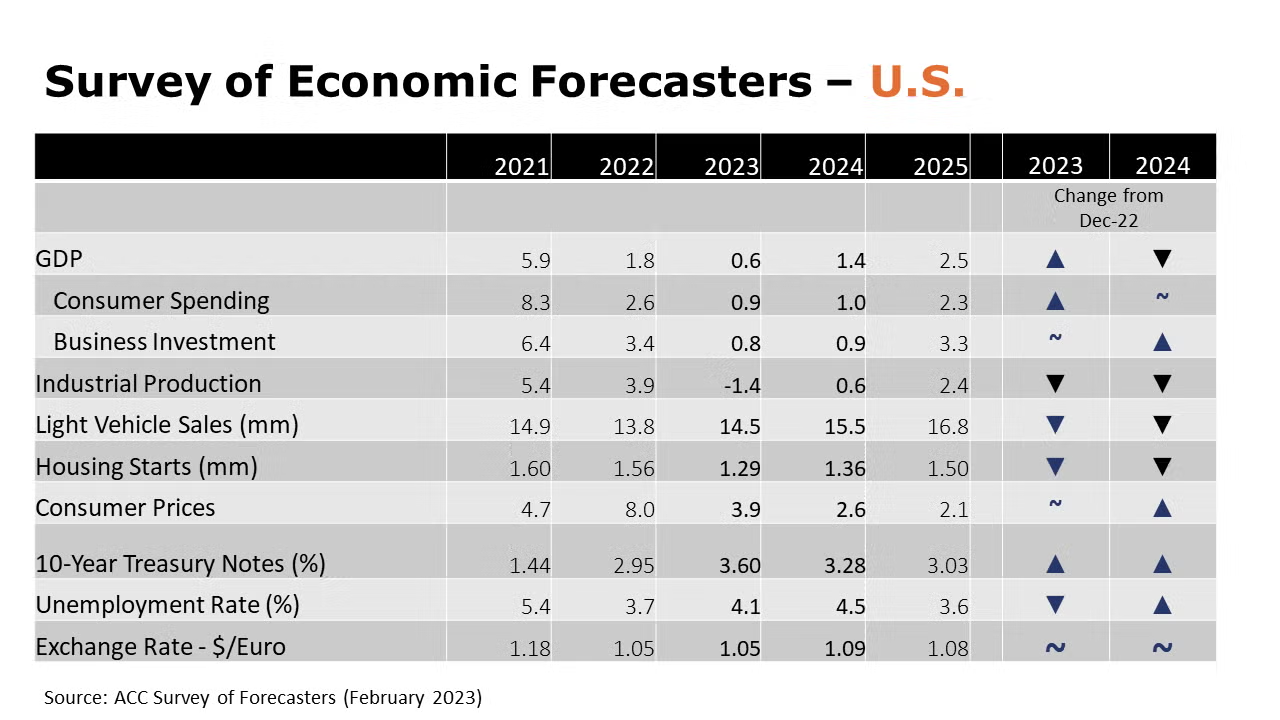
- Vehicle sales jumped at the beginning of the year as inventories expanded following years of supply chain problems. However, higher borrowing costs and economic uncertainty will temper pent-up demand that has accrued over the past three years. As a result, sales of autos and light trucks are expected to grow to 14.5 million in 2023 (well below trend) and 15.5 million in 2024.
- As mortgage rates remain above 6%, expectations for interest rate-sensitive housing continue to show a lower level of homebuilding. Housing starts are expected to come in at 1.29 million in 2023, before edging higher to 1.36 million in 2024.
- The unemployment rate is expected to move higher from 50-year lows to 4.1% in 2023 and 4.5% in 2024.
- Following an 8.0% surge in consumer prices in 2022, growth in consumer prices are expected to decelerate to a 3.9% pace in 2023 and 2.6% in 2024.
- Compared to last month, expectations for interest rates (10-year Treasury) were higher as recent data suggest additional Fed tightening will be necessary.
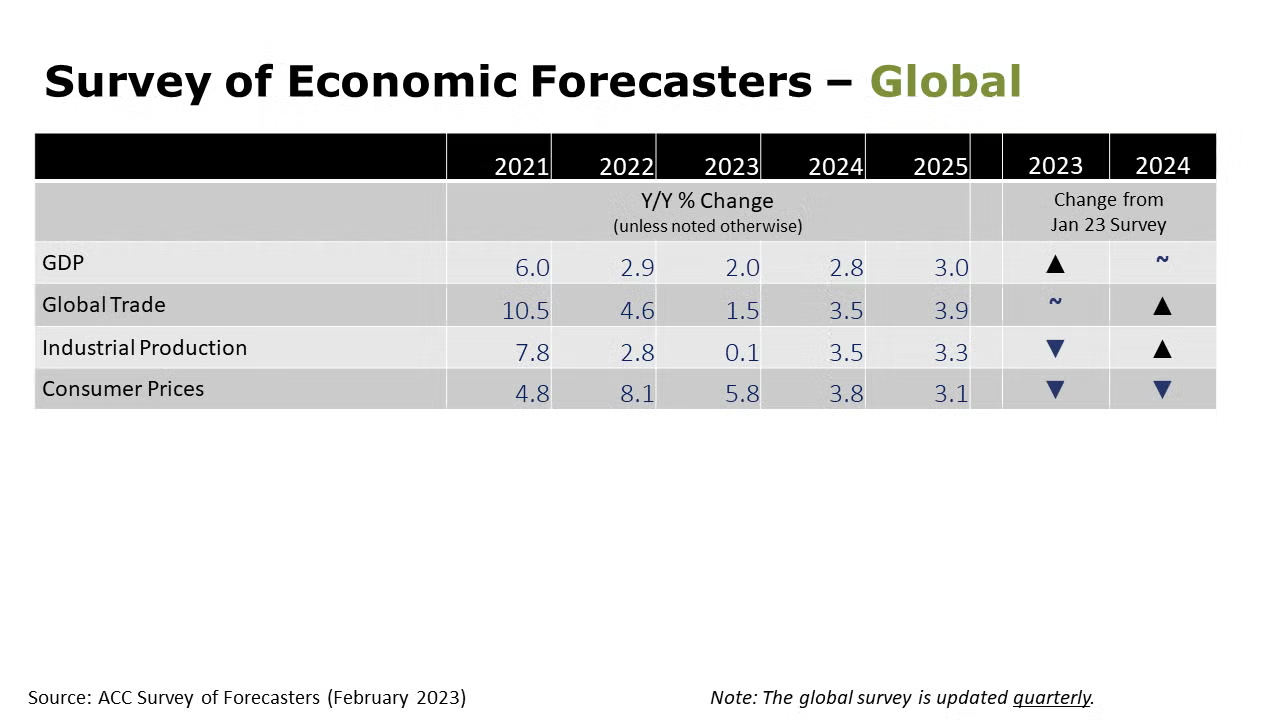
- Global economic growth slowed to a 2.9% pace in 2022 and is forecast to grow 2.0% this year before improving to a 2.8% pace of growth in 2024.
- Weak economic growth worldwide and continued inflationary pressure will pull down demand for industrial output this year. Additionally, high energy and feedstock costs are expected to continue to hamper manufacturing activity. Forecasters estimate global industrial production rose 2.8% last year and over the course of 2023, will expand just barely (about 0.1%) before rising 3.5% in 2024 and 3.3% in 2025.
- Even as supply chain challenges have eased somewhat, global trade flows are likely to lag overall economic growth this year. World trade will slow to a 1.5% gain this year and then grow 3.5% in 2024 and 3.9% in 2025.
- After rising to an 8.1% pace in 2022, global inflation is expected to remain high through 2023 (estimated 5.8%) before moderating to 3.8% in 2024 and 3.1% in 2025.
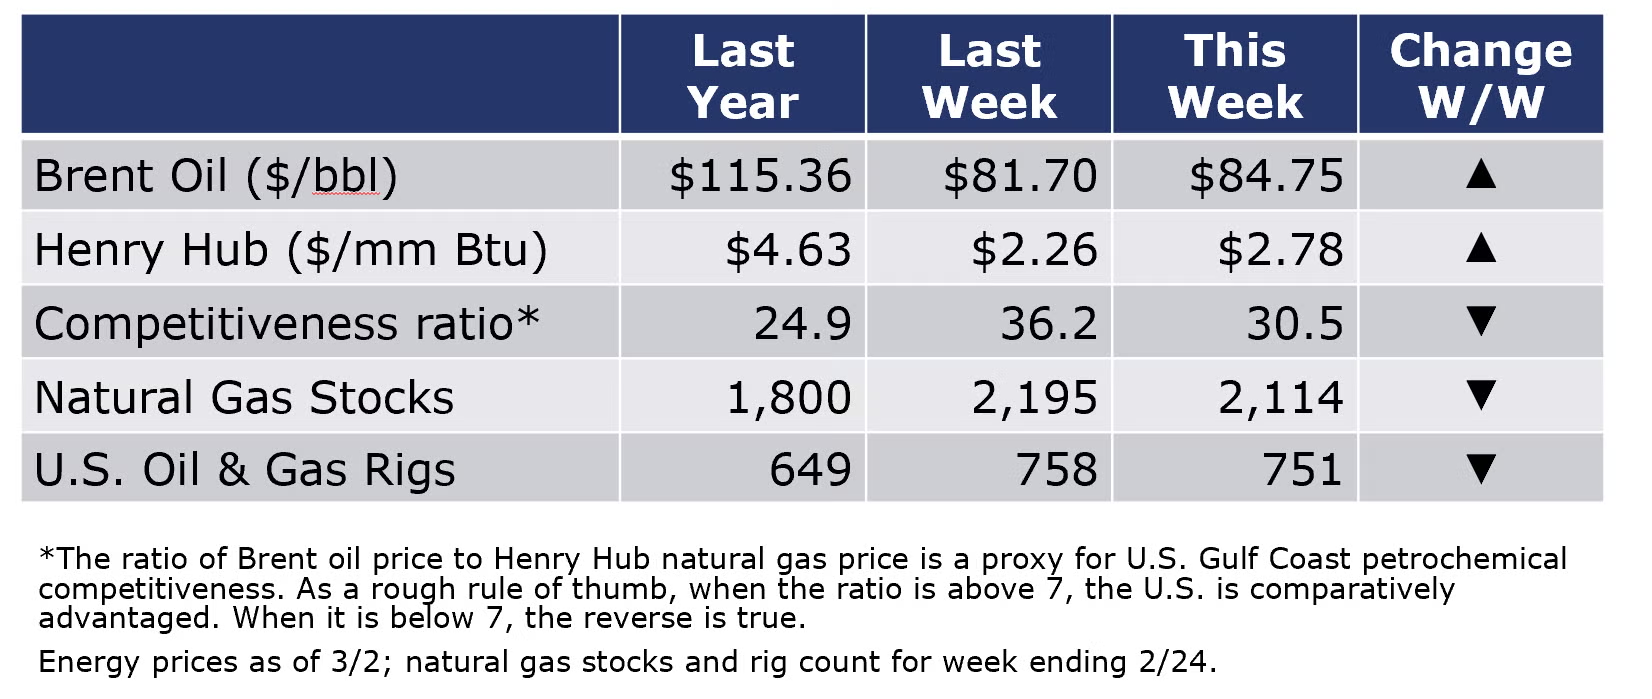
Oil prices tightened again this week on positive economic news from China that was only partially offset by another inventory build in the U.S. Natural gas futures also rose during the week. The combined oil and gas rig count fell by seven to 751 during the week ending 26 February.
For the business of chemistry, the indicators brings to mind a red banner for basic and specialty chemicals
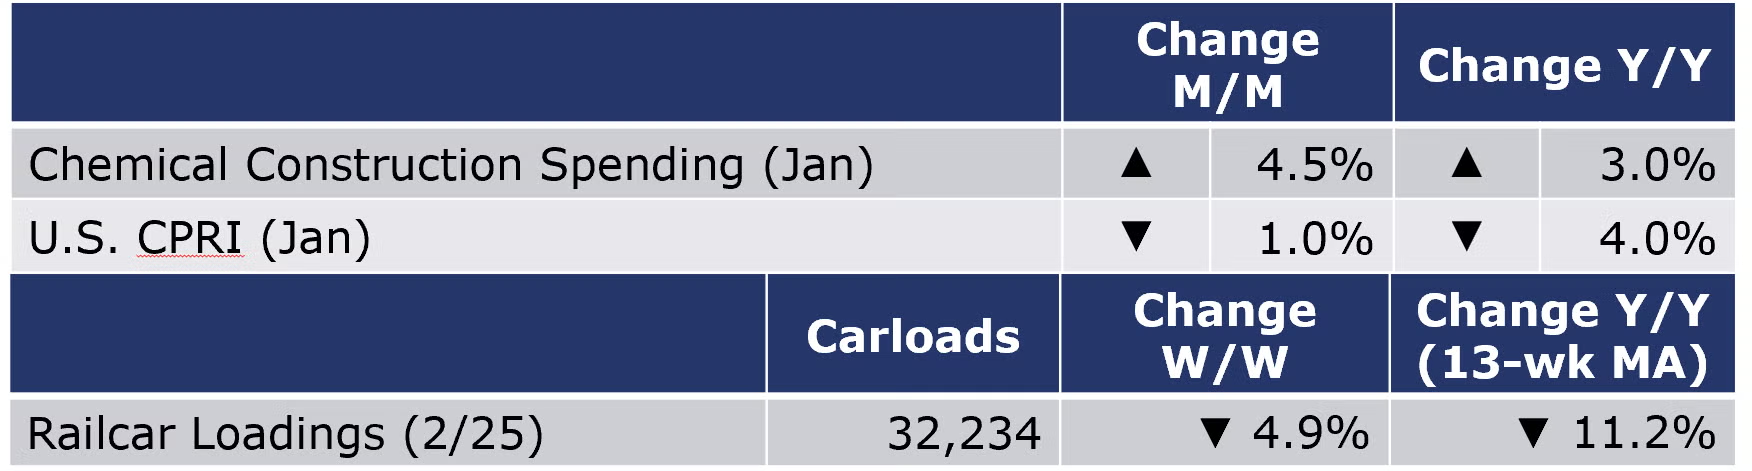
According to data released by the Association of American Railroads, chemical railcar loadings were down to 32,234 for the week ending February 25. Loadings were down 11.2% Y/Y (13-week MA), down (8.0%) YTD/YTD and have been on the rise for 8 of the last 13 weeks.
Within the details of the ISM Manufacturing PMI® report, the chemical industry was reported to be one of 14 industries that contracted in February. Having declined in January, chemical industry production, new orders and imports were neutral (neither increasing nor declining), but employment and new export orders contracted. Among the comments, one chemical industry respondent noted, “a slowdown in new housing construction and concerns of a slowing economy have customers delaying purchases in an effort to destock.” A respondent from the plastics & rubber products industry reported “business and new orders are softening, and customers are pushing out current orders.”
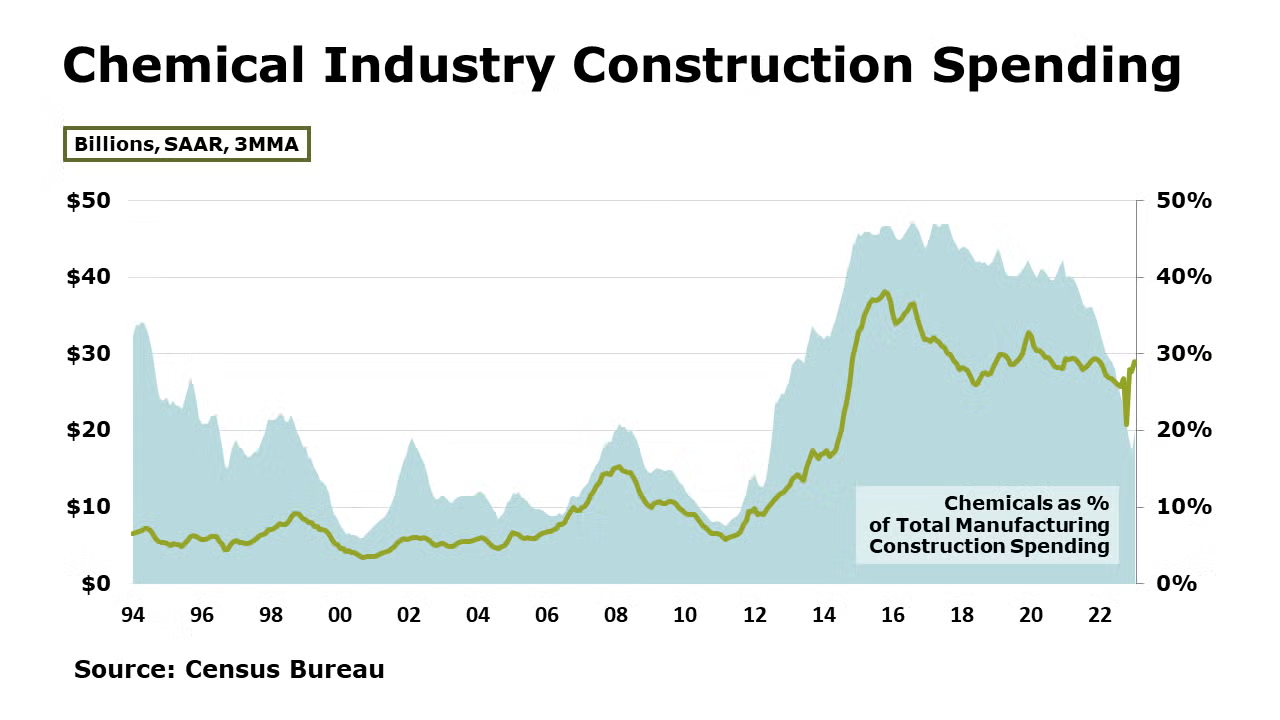
Chemical industry construction spending rose 4.5% in January and was up 3.0% Y/Y. Chemical construction spending as a percent of total manufacturing construction spending was 20.7% in January. The comparison has been softening gradually after climbing to a sustained high proportion (around 46%) during 2014-2017.
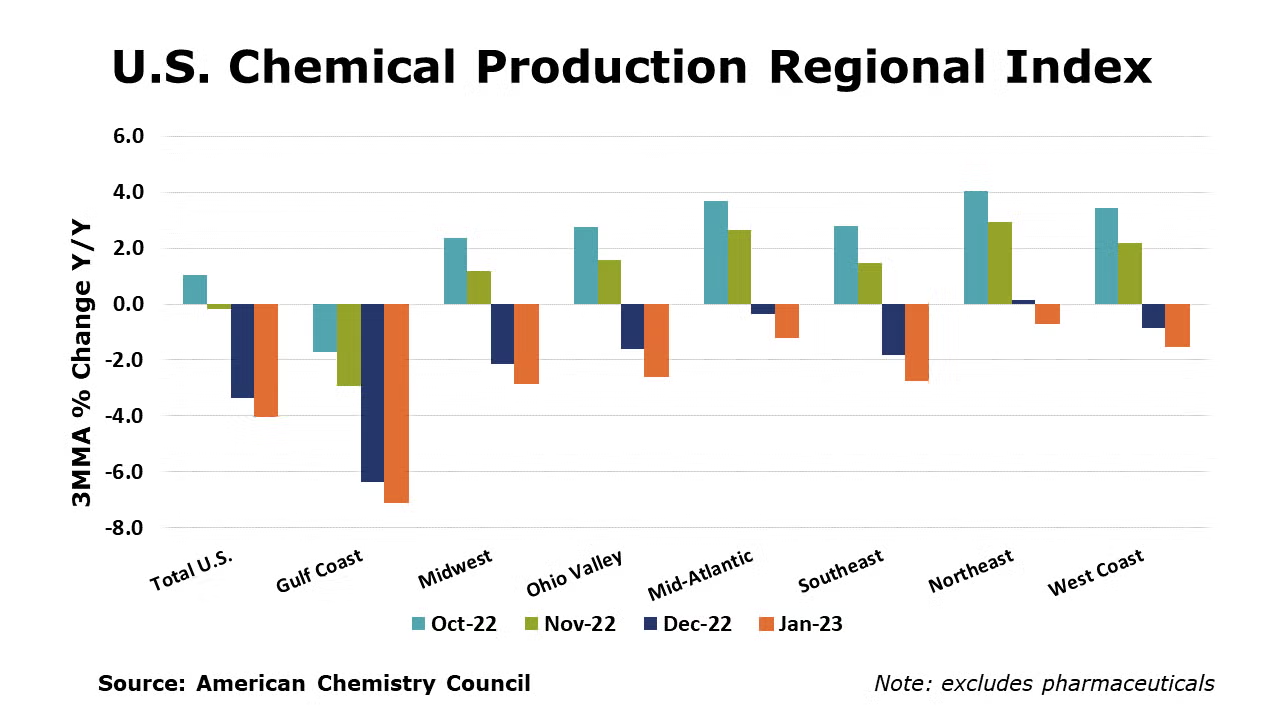
The U.S. Chemical Production Regional Index (U.S. CPRI) fell 1.0% in January following declines of 1.6% in November and 0.6% in December, according to the American Chemistry Council (ACC). Chemical output was lower than a month ago in all regions, with the largest declines in the Gulf Coast, home to much of the nation’s basic industrial chemical and synthetic materials capacity. Because the CPRI is measured as a three-month moving average (3MMA), the declines reflect not only, continued contraction across multiple key end-use industries, but also lingering disruptions from winter storm Elliott that hit in late December, which impacted the U.S. Gulf Coast, in particular. Compared with January 2022, U.S. chemical production was 4.0% lower. Chemical production was lower than a year ago in all regions, with the largest declines in the Gulf Coast.
On a 3MMA basis, chemical production within segments was mixed in January. Output of fertilizers, synthetic dyes & pigments and industrial gases were higher, but declines persisted in all other segments compared to a month earlier.
As nearly all manufactured goods are produced using chemistry in some form, manufacturing activity is an important indicator for chemical demand. Down for a third consecutive month, manufacturing output was down 0.6% in January on a 3MMA basis. The 3MMA trend in manufacturing production was mixed, with most chemistry-consuming segments contracting. Output continued to expand, however, in aerospace and apparel.
Note On the Color Codes
The banner colors represent observations about the current conditions in the overall economy and the business chemistry. For the overall economy we keep a running tab of 20 indicators. The banner color for the macroeconomic section is determined as follows:
Green – 13 or more positives
Yellow – between 8 and 12 positives
Red – 7 or fewer positives
For the chemical industry there are fewer indicators available. As a result we rely upon judgment whether production in the industry (defined as chemicals excluding pharmaceuticals) has increased or decreased three consecutive months.
For More Information
ACC members can access additional data, economic analyses, presentations, outlooks, and weekly economic updates through MemberExchange.
In addition to this weekly report, ACC offers numerous other economic data that cover worldwide production, trade, shipments, inventories, price indices, energy, employment, investment, R&D, EH&S, financial performance measures, macroeconomic data, plus much more. To order, visit http://store.americanchemistry.com/.
Every effort has been made in the preparation of this weekly report to provide the best available information and analysis. However, neither the American Chemistry Council, nor any of its employees, agents or other assigns makes any warranty, expressed or implied, or assumes any liability or responsibility for any use, or the results of such use, of any information or data disclosed in this material.
Contact us at ACC_EconomicsDepartment@americanchemistry.com

