Running tab of macro indicators: 9 out of 20
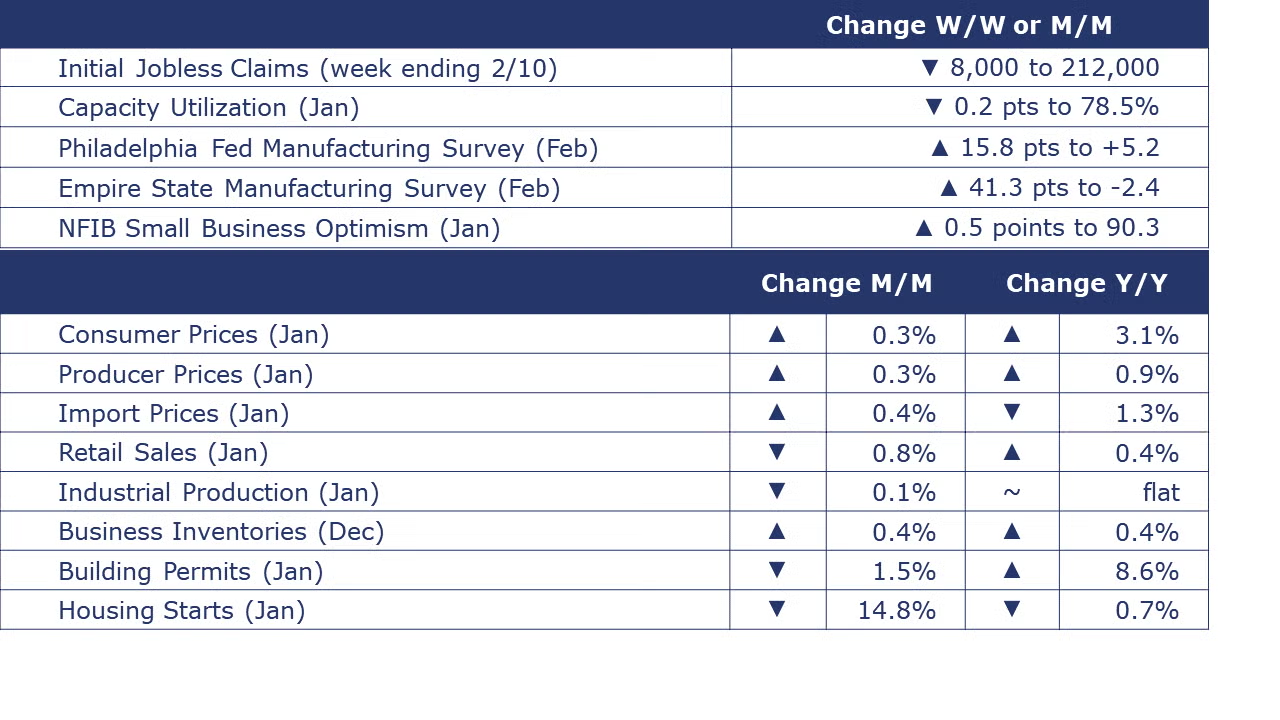
The number of new jobless claims fell by 8,000 to 212,000 during the week ending February 10. Continuing claims increased by 30,000 to 1.89 million, and the insured unemployment rate for the week ending February 3 was up 0.1% to 1.3%.
Retail sales were down 0.8%, reflecting the deep freeze most of the country felt in January. The largest declines were in building materials and motor vehicles as consumers stayed indoors. The decline in gas station sales reflecting lower gasoline prices in January. Sales at furniture & home furnishings stores, grocery stores and restaurants were higher in January. Compared to a year ago, retail sales were up 0.4%.
Overall inflation, measured by the consumer price index (CPI), rose 0.3% in January and at a 3.1% annual rate. The annual rate comparison has come down considerably from the 9% peak in June 2022 but has bounced stubbornly between 3-4% since June, well above the Fed’s 2% target. Core inflation, measured by the core CPI, which excludes changes in food and energy prices, rose 0.4% in January and rose at a 3.9% annual rate, the second month in a row this measure has been below 4% since May 2021. Energy prices were down 0.9% in January and down 4.6% Y/Y. New vehicle prices remain unchanged while prices on used cars and trucks were down 3.4%. Grocery prices (food at home prices) rose 0.4% in January and were up 1.2% Y/Y. For the sixth straight month, rent rose (another 0.6%) and was up 6.0% Y/Y.
Following a 0.1% decline in December, producer prices rose 0.3% in January. The overall index for final demand goods fell for a fourth consecutive month but were more than offset by higher prices for services which accelerated. Declines in food and energy prices offset higher prices for core goods. On the services side, prices accelerated, except for transportation and warehousing. Compared to a year ago, headline producer prices were up 0.9% Y/Y. Core producer prices were up 2.6% Y/Y, the same annual comparison as in December.
Import prices were up 0.8% in January, led by higher prices for both fuel and nonfuel imports. This was the first M/M increase since September and the largest monthly advance since March 2022. Export prices also rose 0.8% M/M, with higher nonagricultural export prices more than offsetting lower agricultural prices.
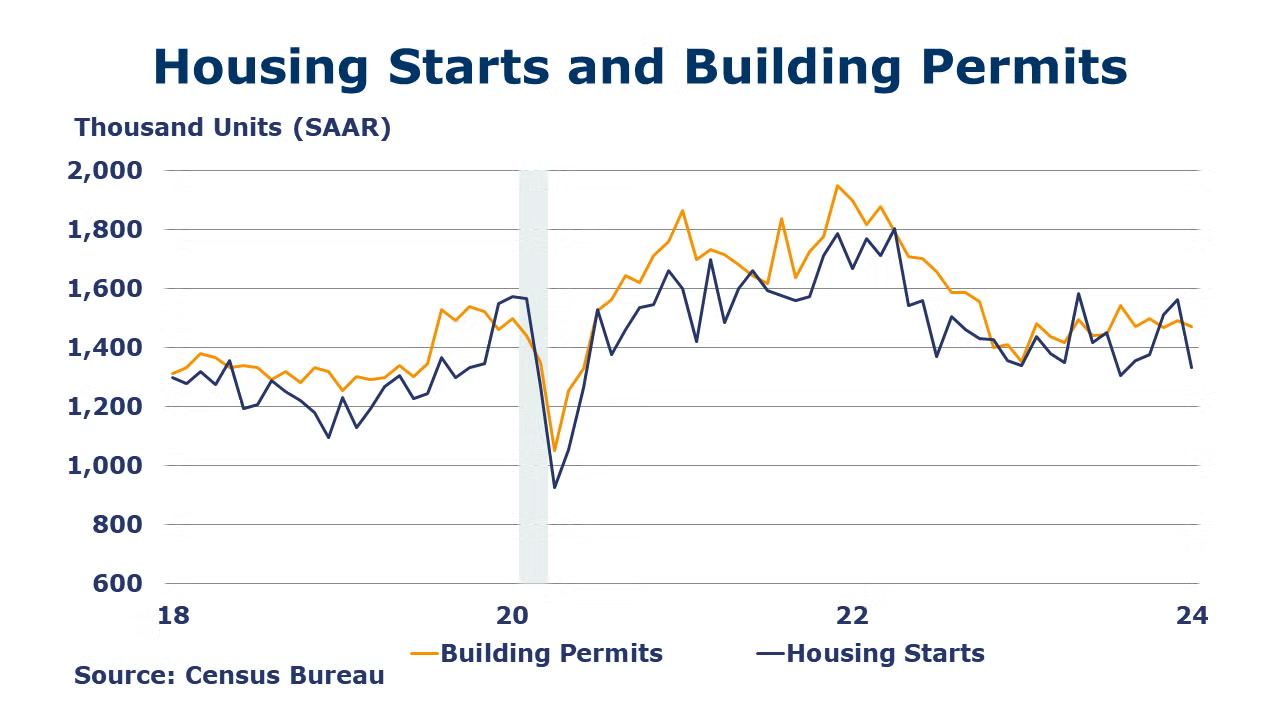
Housing starts tumbled in January, down by 14.8% with declines in both single- and multi-family units. Weather was likely a major factor, but buyers may be waiting for mortgage rates to come down as the Fed has signaled that it is done raising rates. Forward-looking building permits for all kinds of housing structures fell 1.5%, while permits for single-family construction rose for a second month to their highest level since May 2022 when higher interest rates started to take a bite out of housing demand. Compared to last January, building permits were up 8.6% Y/Y, while housing starts were off 0.7% Y/Y.
Homebuilder confidence rose for a third consecutive month in January, however it remains below the 50 neutral mark. The NAHB/Wells Fargo index rose by four points to 48. Homebuilders are optimistic that Fed rate cuts will improve affordability and support homebuilding demand.
Combined business sales for manufacturers, retailers and wholesalers increased 0.4% in November to a level up 2.2% Y/Y. Business inventories were also up 0.4% M/M and up 0.4% higher on a Y/Y basis. As a result, the business inventories-to-sales ratio was 1.37 in December, slightly lower than a year ago December (1.40). Inventories for motor vehicles & parts dealers were up 23% Y/Y.

With a winter storm that disrupted production across parts of the U.S., overall industrial production fell by 0.1% in January. While utility output was sharply higher, mining (especially oil & gas) and manufacturing declined. Manufacturing output fell by 0.5%, the largest decline since October’s 0.9% decline related to the UAW strike. Within manufacturing, the largest gains were in the output of electrical equipment, aerospace, electronics, printing and fabricated metal products. Those gains were more than offset by lower production of refined petroleum products, chemicals, plastics & rubber products, food & beverages, textiles, machinery, and motor vehicles. Compared to last January, industrial production was flat. Capacity utilization fell by 0.2 points to 78.5%. This was lower than a year ago when capacity utilization was 79.6%. Over the same period, overall industrial capacity grew by 1.4%.
Small business optimism declined two points in January to 89.9, marking the 25th straight month below the historical average. Expectations of real sales declined 12 points from December. Overall, the data indicate inflation to be a continuing obstacle.
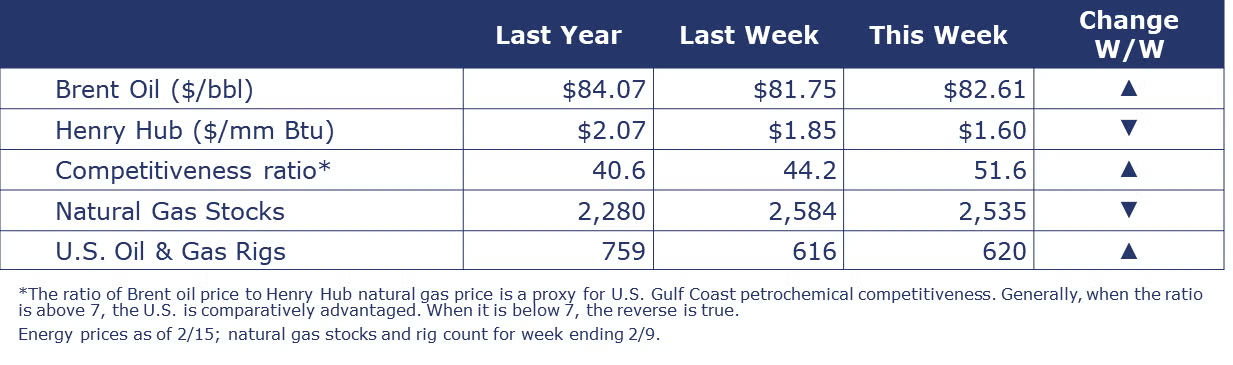
Despite an unexpectedly large build in U.S. commercial crude oil inventories, oil prices (Brent) were higher than a week ago. U.S. natural gas prices continued to drop last week to their lowest level since July 2020 as a comparatively mild winter has dampened demand. The combined oil and gas rig count rose by 4 to 620. With comparatively warmer weather across much of the U.S. last week, the draw in natural gas inventories was modest for this time of the year.
Indicators for the business of chemistry bring to mind a yellow banner.
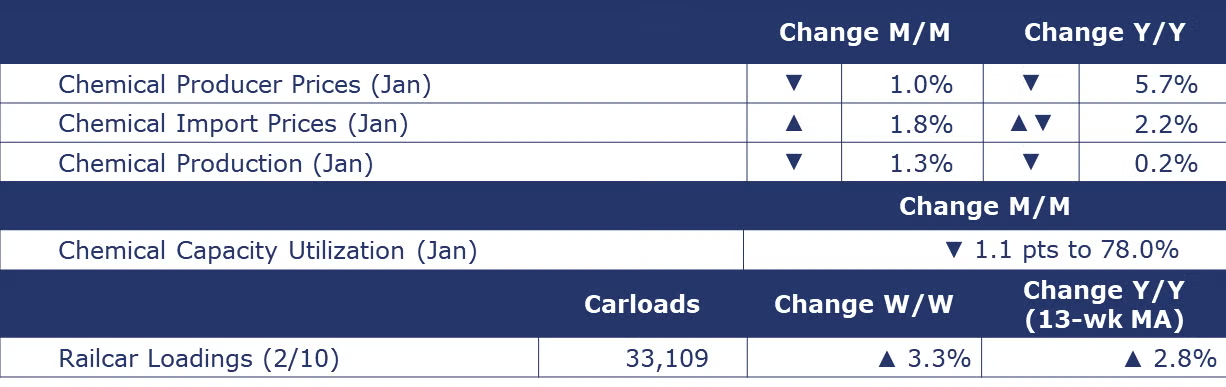
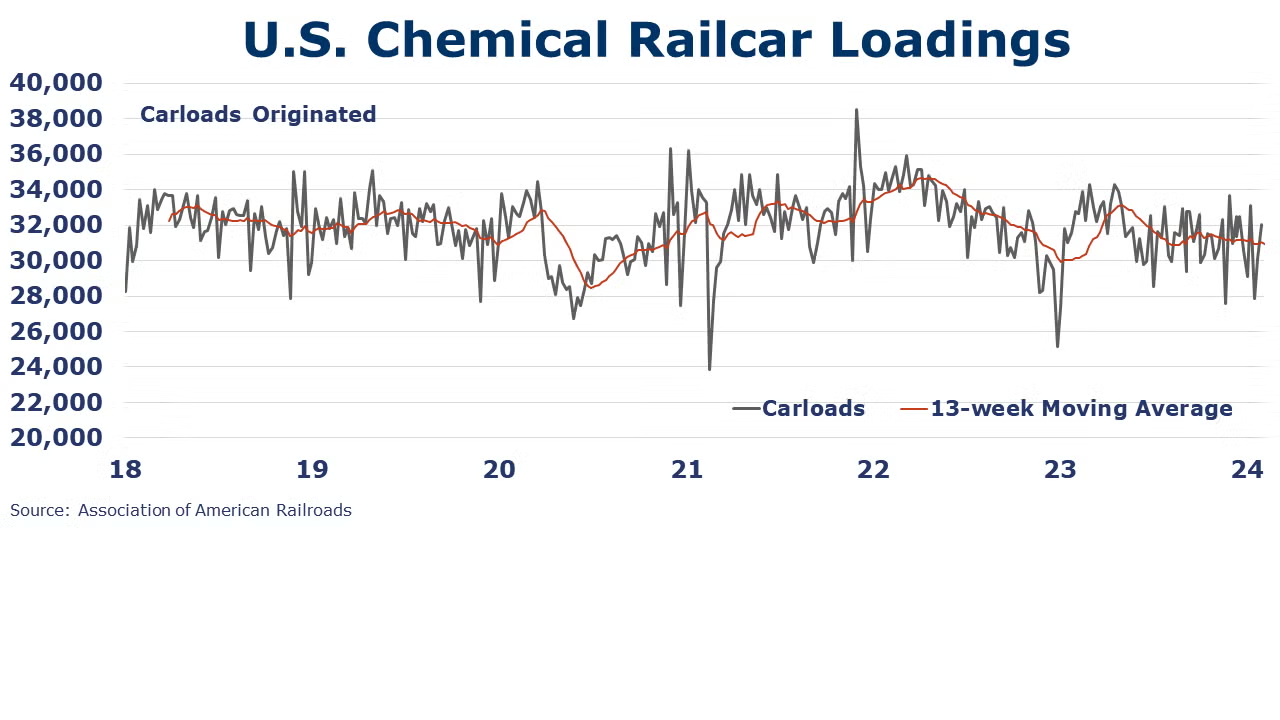
According to data released by the Association of American Railroads, chemical railcar loadings were up to 33,109 for the week ending February 10. Loadings were up 2.8% Y/Y (13-week MA), up (3.4%) YTD/YTD and have been on the rise for 7 of the last 13 weeks.
Chemical producer prices continued to decline in January, down by 1.0%. Slightly higher prices for coatings and consumer products were more than offset by lower prices for organic and inorganic chemicals, synthetic rubber, manufactured fibers, and other specialty chemicals. Prices for plastic resins and agricultural chemicals were flat. Compared to last January, chemical prices were lower by 5.4% Y/Y.
Chemical import prices were up 1.8% in January compared to the previous month, but down 2.2% on a Y/Y basis. Chemical export prices fell 1.1% M/M and 2.5% Y/Y.
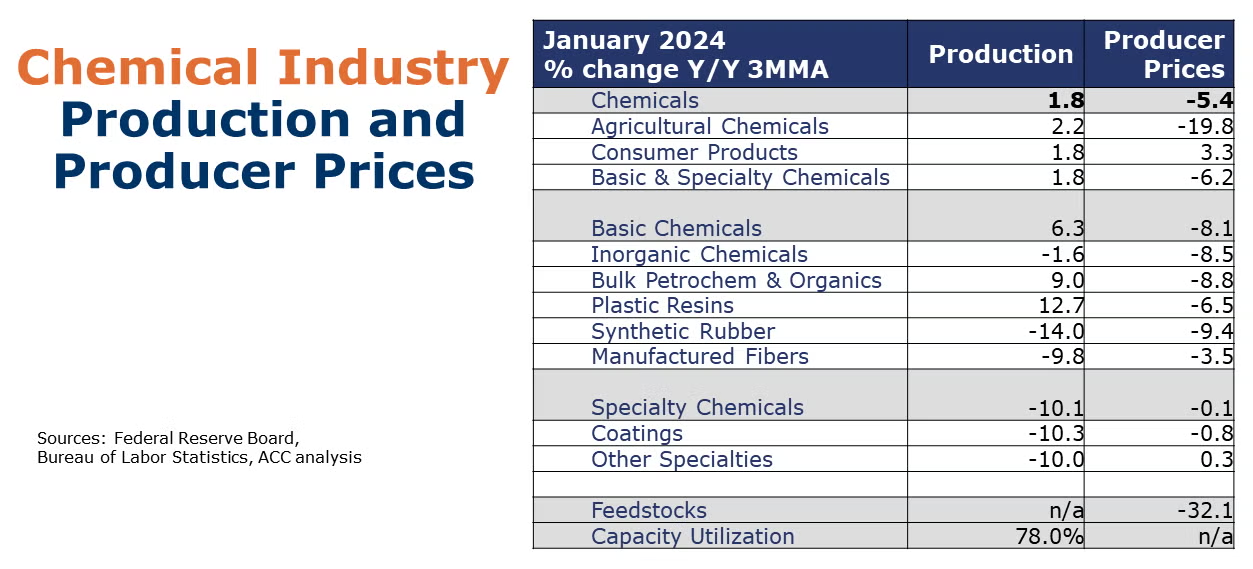
Chemical production (as measured by the Federal Reserve industrial production indices) fell 1.3% in January. There were broad declines across most categories except inorganic chemicals and consumer products. Compared to last January, chemical output was down 0.2% Y/Y. Chemical capacity utilization fell by 1.1 points to 78.0%.
Note On the Color Codes
Banner colors reflect an assessment of the current conditions in the overall economy and the business chemistry of chemistry. For the overall economy we keep a running tab of 20 indicators. The banner color for the macroeconomic section is determined as follows:
Green – 13 or more positives
Yellow – between 8 and 12 positives
Red – 7 or fewer positives
There are fewer indicators available for the chemical industry. Our assessment on banner color largely relies upon how chemical industry production has changed over the most recent three months.
For More Information
ACC members can access additional data, economic analyses, presentations, outlooks, and weekly economic updates through ACCexchange.
In addition to this weekly report, ACC offers numerous other economic data that cover worldwide production, trade, shipments, inventories, price indices, energy, employment, investment, R&D, EH&S, financial performance measures, macroeconomic data, plus much more. To order, visit http://store.americanchemistry.com/.
Every effort has been made in the preparation of this weekly report to provide the best available information and analysis. However, neither the American Chemistry Council, nor any of its employees, agents or other assigns makes any warranty, expressed or implied, or assumes any liability or responsibility for any use, or the results of such use, of any information or data disclosed in this material.