Running tab of macro indicators: 13 out of 20
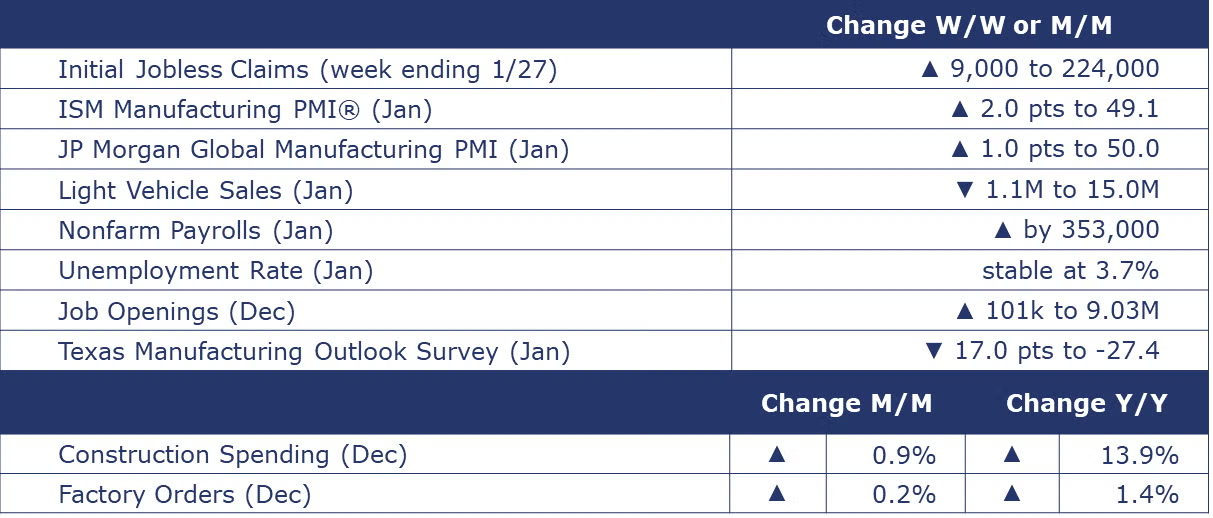
Nonfarm payrolls rose by 353,000 in January, once again coming in well ahead of expectations. Job gains were broad based with increases across most major sectors. Overall manufacturing employment was higher by 23,000, with chemical manufacturing among the leaders. Average hourly earnings rose at a 4.5% Y/Y pace to $34.55. The unemployment rate was stable for a third month at 3.7% and there was little change in the number of unemployed people (6.1 million).
The number of new jobless claims rose by 9,000 to 224,000 during the week ending January 27. Continuing claims increased by 70,000 to 1.89 million, and the insured unemployment rate for the week ending January 20 was up 0.1% at 1.3%.
Job openings rose for a second straight month in December, up by 101,000 to 9.03 million. There were 1.4 job openings per unemployed person, far lower than the 2.0 openings per unemployed person last December. A sign of cooling, however, the quits rate fell to 2.2%, the lowest in more than three years as workers become increasingly reluctant to leave a job voluntarily. While the labor market has cooled, it remains historically tight.
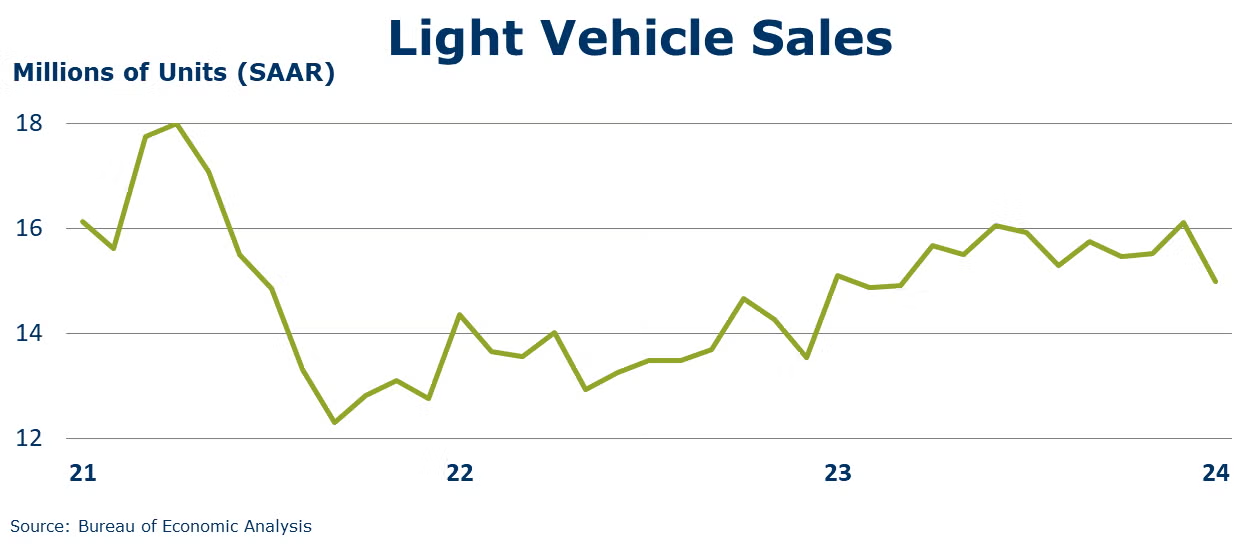
Light vehicle sales declined by 1.1 million to a 15.0 million seasonally adjusted annual rate (SAAR) in January, with decreases in both the passenger car and light truck (including SUVs and minivans) categories. The share of “light trucks” is at 80% and has been steadily increasing for decades.
Factory orders continued to expand in December, up by 0.2%. Core business orders (nondefense capital orders, excluding aircraft) were also higher by 0.2%. There were gains in new orders for construction materials, information technology, motor vehicles & parts, and consumer nondurables. Unfilled orders (a measure of the manufacturing pipeline) had another solid 1.3% gain. Manufacturing shipments were flat, however. Inventories were slightly higher (up by 0.1%), following two months of flat growth. The inventories-to-shipments ratio for the broader manufacturing sector was stable (compared to November) at 1.48, but down from 1.49 last December.
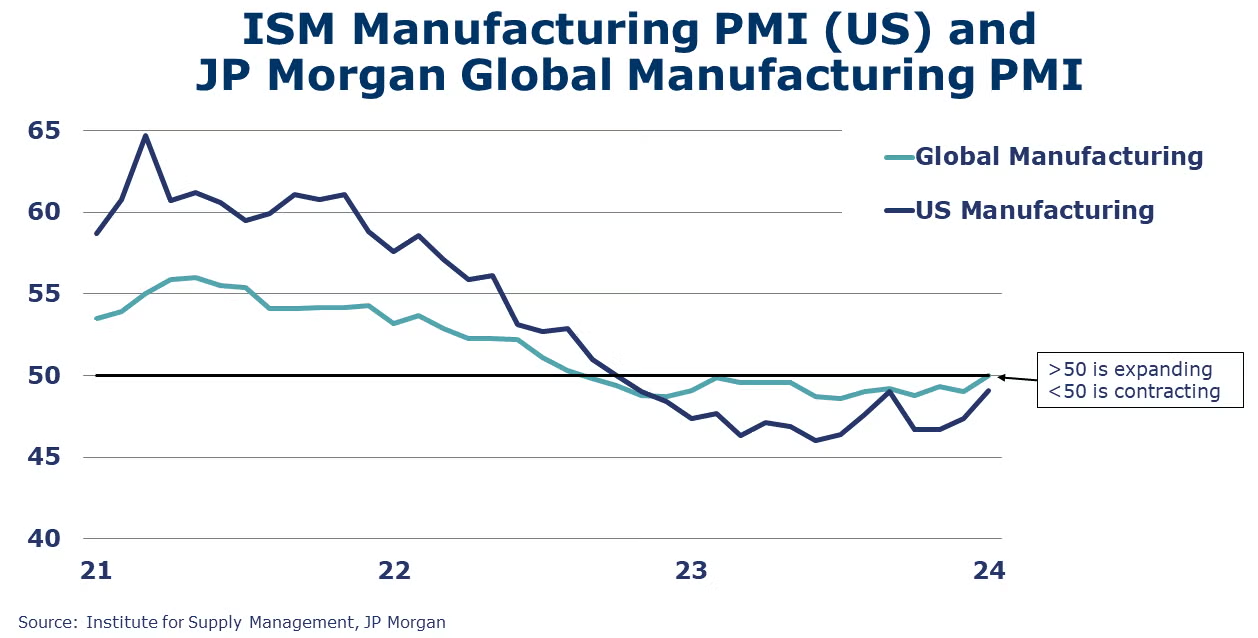
The ISM Manufacturing PMI® edged up to 49.1% in January. It was the 15th consecutive reading under the 50-mark, which indicates contraction in the U.S. industrial sector. Manufacturers are facing higher demand as new orders increased although export orders declined. Customers’ inventories contracted further, signaling possible future production. Of the 17 manufacturing industries tracked, 4 reported growth – transportation equipment; chemical products, textile mills; and apparel, and leather and allied products.
Following 15 months of contraction, J.P. Morgan’s Global Manufacturing PMI® rose 1.0 points to 50.0 in January, indicating global manufacturing is on the brink of expansion. The readings for output, new orders and new export orders declined. Sentiment improved and growth is expected in future output. Employment contracted at a faster rate. Fourteen of the 29 countries tracked saw expansion in output.
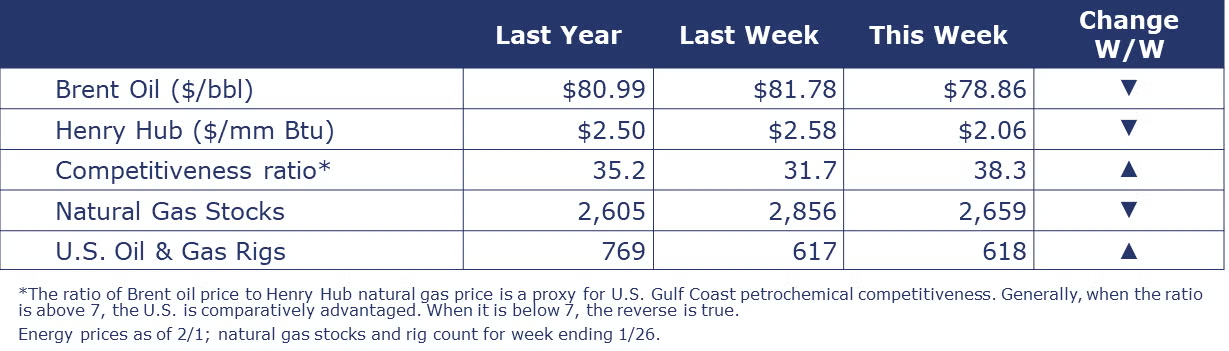
Oil prices eased as efforts are ongoing to negotiate a cease-fire in the Israel-Hamas war. U.S. natural gas prices fell to their lowest level since last April. The combined oil and gas rig count rose for a second straight week by one to 618.
Indicators for the business of chemistry bring to mind a yellow banner.
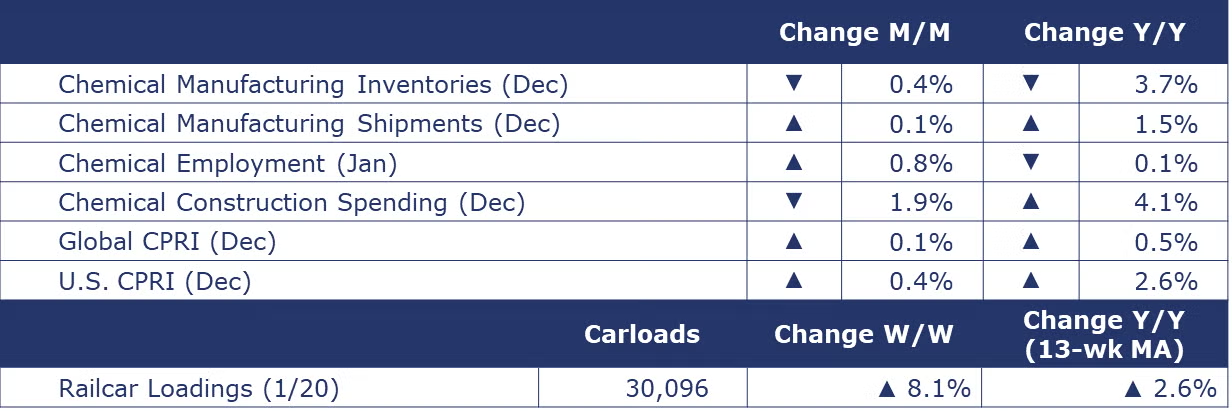
According to data released by the Association of American Railroads, chemical railcar loadings were up to 30,096 for the week ending January 27. Loadings were up 2.6% Y/Y (13-week MA), up (3.1%) YTD/YTD and have been on the rise for 6 of the last 13 weeks.
The U.S. Chemical Production Regional Index (CPRI) was higher in December (by 0.4%) for the first time in four months. There were gains across all regions, except the Gulf Coast, where output continued to decline. The decline in the Gulf Coast reflected ongoing weakness in demand for basic industrial chemicals and synthetic materials, a large share of which are produced in that region. Compared to last December (when a late-month freeze event disrupted production), U.S. chemical production was 2.6% higher.
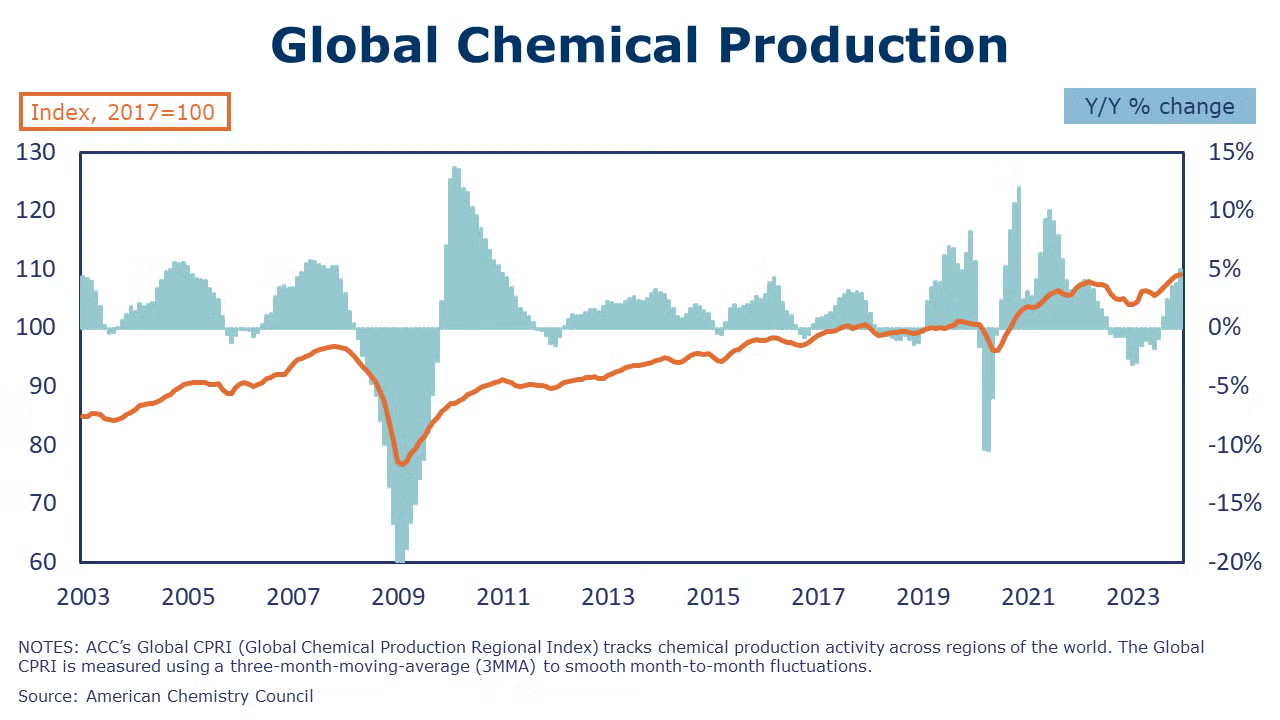
Following a 0.5% gain in November the growth of ACC’s Global Chemical Production Regional Index (Global CPRI) eased to 0.1%. Growth was mainly driven by the United States, Canada, China, Korea, Taiwan, and Germany. On a regional basis, production increased in Asia and North America but declined elsewhere. Output was up in all segments. Global chemicals production growth was up 0.5% Y/Y.
In the ISM Manufacturing PMI® report for January, chemical products was one of only four industries reporting expansion. According to a participant in the chemical industry, “The start of 2024 looks good. Sales are above expectations, and costs are mostly stable.”
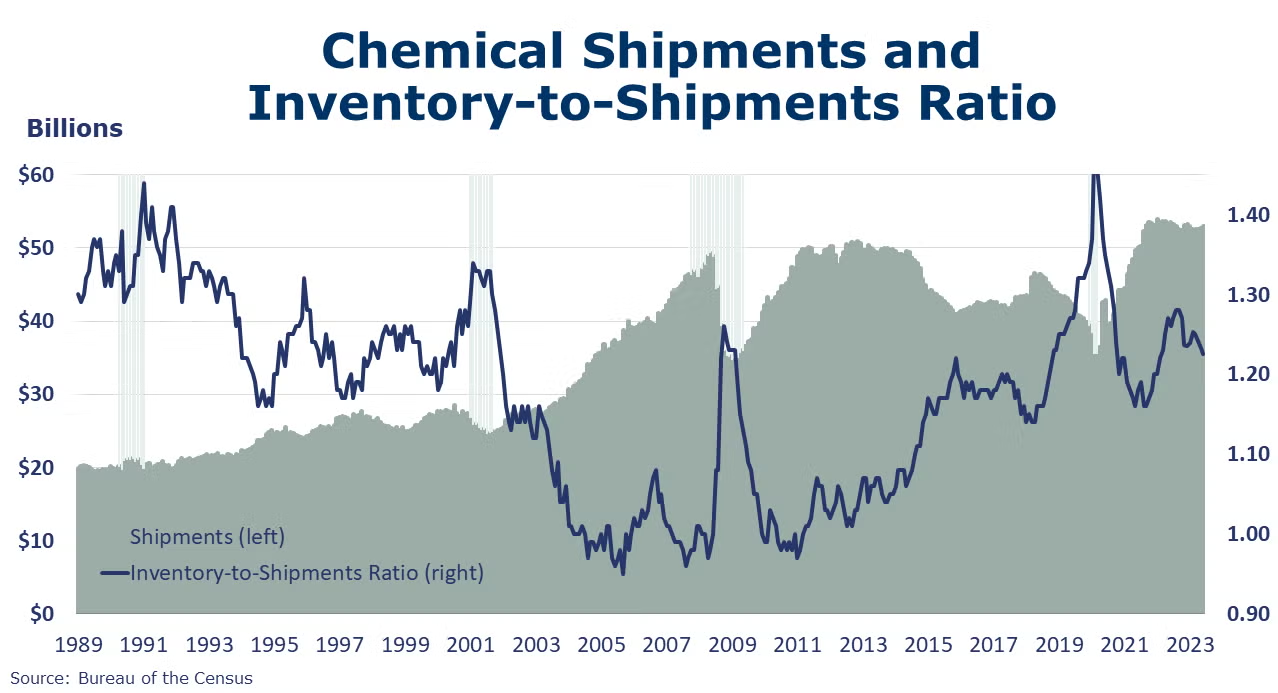
Chemical shipments were up for a third consecutive month in December, higher by 0.1% with gains in agricultural and other chemicals offsetting lower shipments of coatings & adhesives. Chemical inventories fell by 0.4% with declines in agricultural and other chemicals offsetting higher inventories of coatings & adhesives. Compared to a year ago, shipments were 1.5% higher while inventories were down 3.7% Y/Y. The inventories-to-shipments ratio remained steady (compared to November) at 1.21. A year ago, the ratio was 1.27.
Gains in chemical and pharmaceutical industry employment led the overall rise in manufacturing in January. Chemical manufacturers added 6,900 jobs in January, nearly reversing the declines of the previous three months. Much of the gain reflected the addition of production workers. The average workweek declined by 42 minutes to 40.2 hours. Due to the steep drop in the average workweek, the labor input into the chemical industry declined slightly in January. This was in contrast with the ISM Manufacturing PMI® that suggested the chemical industry expanded last month. Average hourly earnings were up 7.5% Y/Y to $30.93.
Chemical industry construction spending moved lower, down by 1.9% in December to a $36.0 billion annual rate. Compared to a year ago, chemical industry construction spending was 4.1% higher Y/Y.
Note On the Color Codes
Banner colors reflect an assessment of the current conditions in the overall economy and the business chemistry of chemistry. For the overall economy we keep a running tab of 20 indicators. The banner color for the macroeconomic section is determined as follows:
Green – 13 or more positives
Yellow – between 8 and 12 positives
Red – 7 or fewer positives
There are fewer indicators available for the chemical industry. Our assessment on banner color largely relies upon how chemical industry production has changed over the most recent three months.
For More Information
ACC members can access additional data, economic analyses, presentations, outlooks, and weekly economic updates through ACCexchange.
In addition to this weekly report, ACC offers numerous other economic data that cover worldwide production, trade, shipments, inventories, price indices, energy, employment, investment, R&D, EH&S, financial performance measures, macroeconomic data, plus much more. To order, visit http://store.americanchemistry.com/.
Every effort has been made in the preparation of this weekly report to provide the best available information and analysis. However, neither the American Chemistry Council, nor any of its employees, agents or other assigns makes any warranty, expressed or implied, or assumes any liability or responsibility for any use, or the results of such use, of any information or data disclosed in this material.
Contact us at ACC_EconomicsDepartment@americanchemistry.com.

