Running tab of macro indicators: 13 out of 20
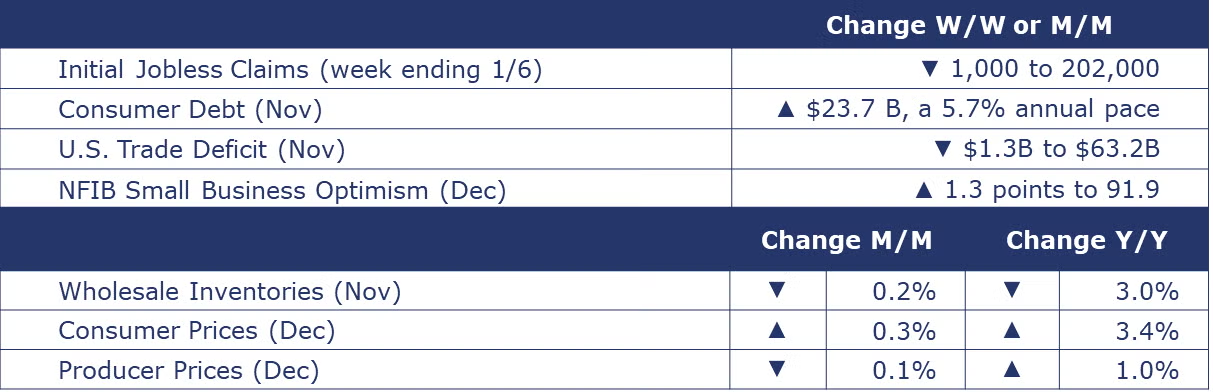
The number of new jobless claims fell by 1,000 to 202,000 during the week ending January 6. Continuing claims fell by 34,000 to 1.834 million, and the insured unemployment rate for the week ending December 30 was down by 0.1% to 1.2%.
Non-mortgage consumer debt surged in November, with balances up by $23.7 billion (a 5.7% annual pace) to a new record $5.0 trillion. While non-revolving debt (e.g., car & student loans) continued to expand, the growth was driven by a large increase in credit card balances (up by a 17.7% annual rate).
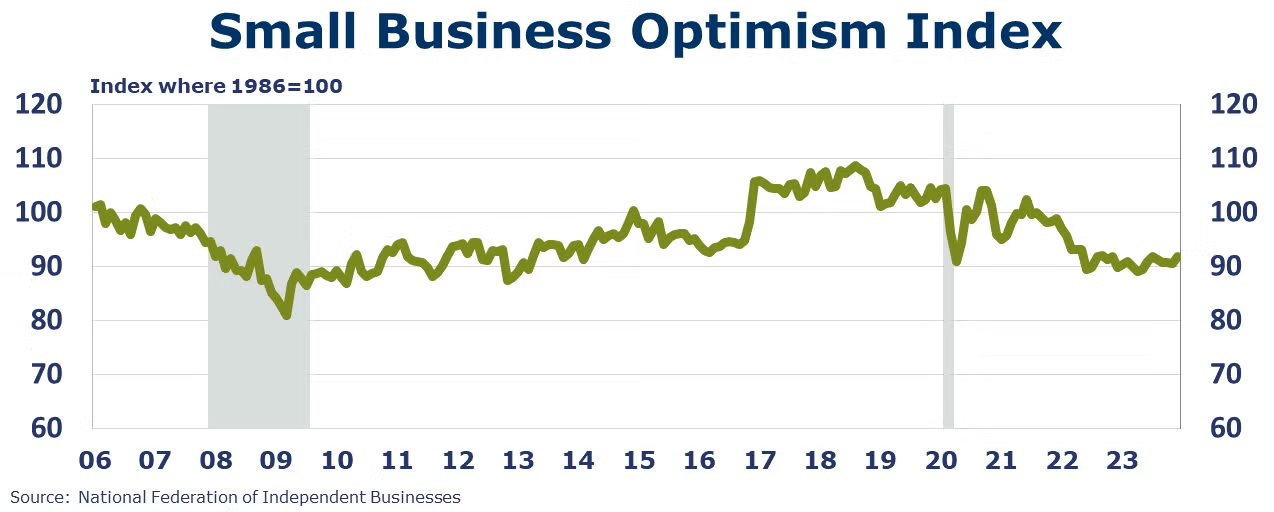
Small business optimism finished the year on a high note with the index tying with July for the highest reading in 2023. The index rose 1.3 points to 91.9. Credit conditions improved in December as did the outlook for sales in the months ahead. Overall, however, the reading suggests that small business owners remain pessimistic. NFIB Chief Economist shared “Small business owners remain very pessimistic about economic prospects this year. Inflation and labor quality have consistently been a tough complication for small business owners, and they are not convinced that it will get better in 2024.”
Overall inflation, measured by the Consumer Price Index (CPI), rose 0.3% in December, higher than expected, and a 3.4% annual rate. The annual rate comparison has come down considerably from the 9% peak in June 2022 but has bounced stubbornly between 3-4% since June, well above the Fed’s 2% target. Core inflation, measured by the core CPI, which excludes changes in food and energy prices, rose 0.3% in December and rose at a 3.9% annual rate, the first time this measure has been below 4% since May 2021. Energy prices were up 0.4% in December and down 2.0% Y/Y. New vehicle prices were up slightly (0.3%) while prices on used cars and trucks were up 0.5%, the second consecutive month of increase. Grocery prices (food at home prices) rose 0.1% in December and were up 1.3% Y/Y. For the fifth straight month, rent rose (another 0.4%) and was up 6.5% Y/Y.
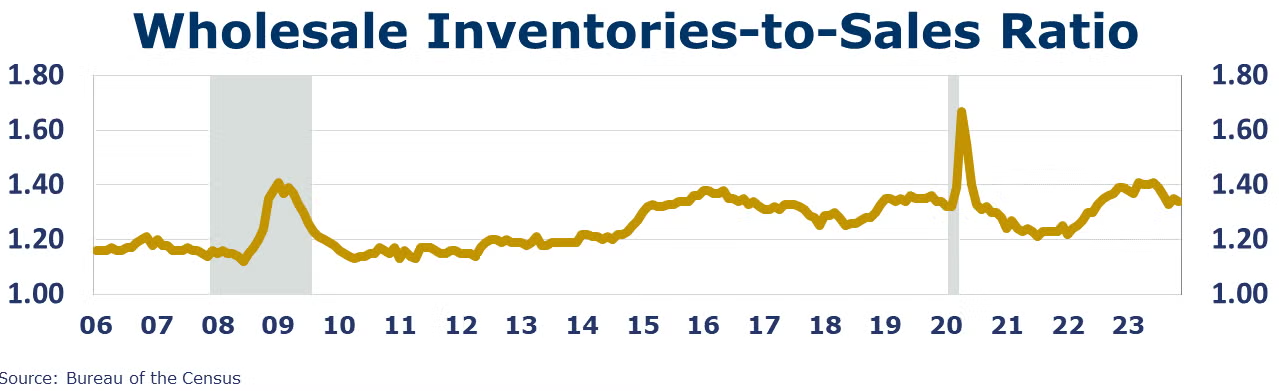
Wholesalers’ sales were $667 billion in November, flat compared to October and up 0.5% Y/Y. Wholesalers’ inventories were $896 billion, down 0.2% M/M and down 3.0% Y/Y. The inventory-to-sales ratio was 1.34, compared to 1.39 a year ago. Chemicals had the largest M/M gain in sales (up 4.4%) and the largest decrease in inventories (down 3.3%). Sales were also up in the alcohol and computer equipment categories; apparel saw the largest decline M/M.
The U.S. trade deficit in goods and services narrowed to $63.2 billion in November. Services exports rose while imports of services decreased. Both imports and exports of goods declined in November. Exports declined in industrial supplies and materials, autos and auto parts, and consumer goods. Imports declined in consumer goods, industrials supplies and materials, and capital goods.
The headline Producer Price Index (PPI) fell slightly (by 0.1%) in December while the core PPI (goods less food and energy) remained flat M/M. Compared to a year ago, headline prices were up 1.0% and core prices were up 0.1%. Compared to November, the largest declines were in eggs (down 20.5%) and diesel (down 12.4%); platinum and gold jewelry was up 2.9%. On a Y/Y basis, the largest increases were in beef and veal (up 20.4%), iron and steel scrap (up 19.4%), and cigarettes (up 11.6%); eggs (down 61.5%) and vegetables (down 51.2%) saw the largest declines.
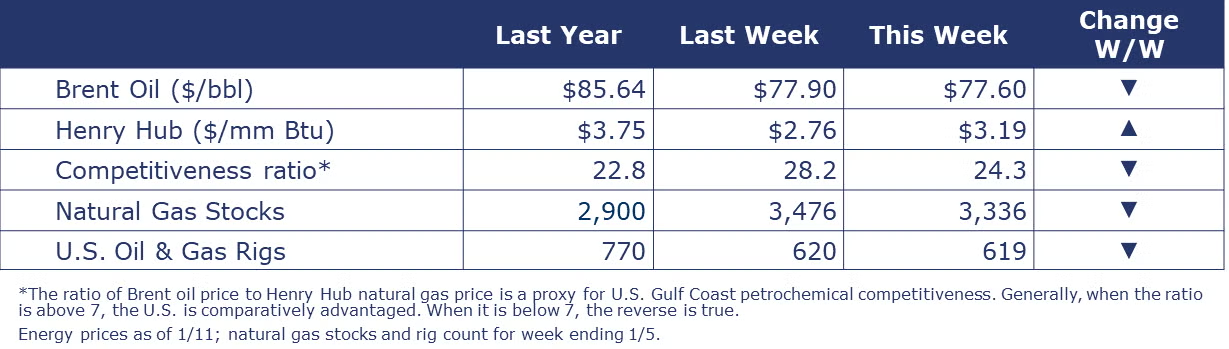
Oil prices see-sawed during the week amid concerns over stepped up attacks in the Red Sea and weakness in the global economy. As a result, oil prices came in just slightly lower than a week ago. U.S. natural gas prices, however, were higher as inventory draws last week were larger than expected. In addition, sharply colder temperatures are expected across much of the U.S. next week. Temperatures in Houston are expected to dip into the lower 20’s early next week, temperatures only slightly warmer than those recorded in February 2021 that caused severe disruptions. ERCOT has issued a watch for higher electrical demand for Texas, though normal grid conditions are expected. The combined oil and gas rig count fell by one to 619.
Indicators for the business of chemistry bring to mind a red banner.
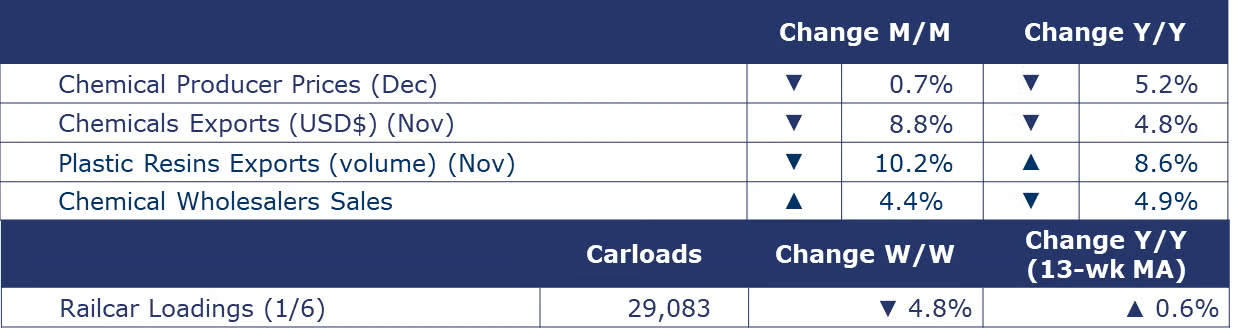
According to data released by the Association of American Railroads, chemical railcar loadings were down 4.8% to 29,083 for the week ending January 6. Loadings were up 0.6% Y/Y (13-week MA) and have been on the rise for 6 of the last 13 weeks.
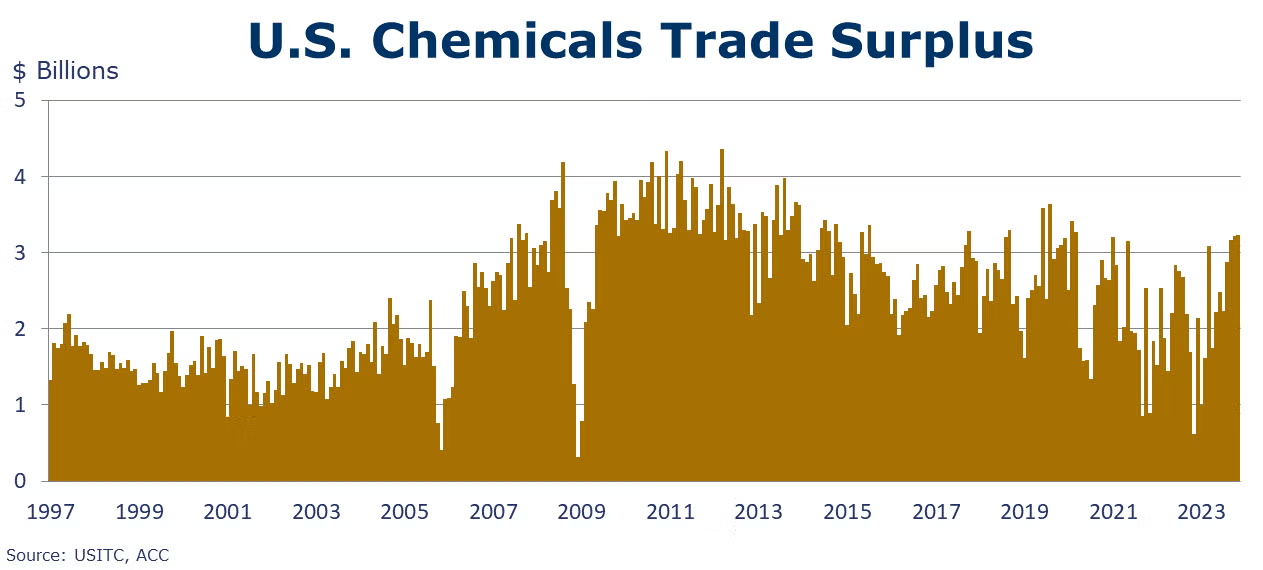
U.S. chemicals exports fell in November by 8.8% to $12.8 billion, a level down 4.8% Y/Y and down 8.6% YTD/YTD. Exports fell in every category except agricultural chemicals (up 8.6%) and coatings (flat). Plastic resin exports were down 6.4% on a value basis and down 10.2% by volume. Chemical imports also declined, by 11.6% to $9.5 billion in November, a level down 25.5% Y/Y and down 13.1% YTD/YTD. Imports fell in every category. The U.S. trade surplus in chemicals broadened by 0.7% to $3.2 billion in November and on a YTD basis, the surplus reached $26.9 billion.
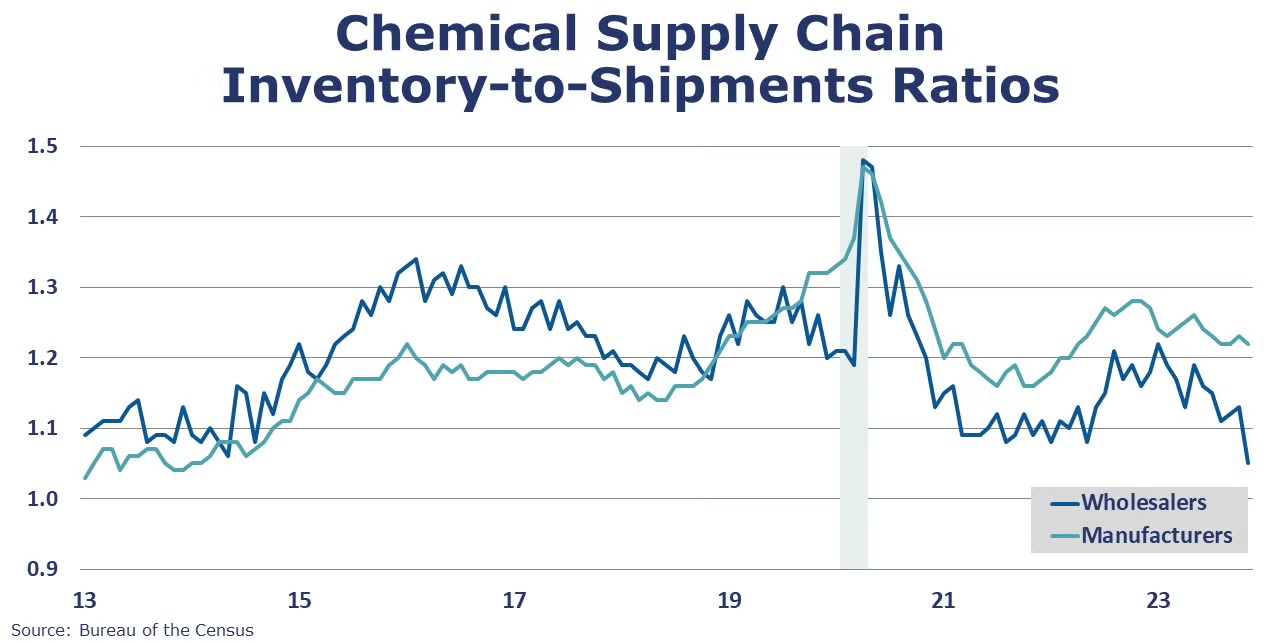
Chemical wholesalers’ sales were $13.9 billion in November, up 4.4% compared to October but down 4.9% Y/Y. Chemical inventories were $14.6 billion, down 3.3% M/M and down 14.5% compared to a year ago. As a result, the chemicals inventories-to-sales ratio fell sharply from 1.13 in October to 1.05 in November, the lowest level in more than a decade.
Chemical producer prices ended the year on a weak note, down by 0.7% in December, the eighth consecutive month of decline. Prices were lower for bulk petrochemicals and organics, plastic resins, synthetic rubber, manufactured fibers, and coatings. These declines were partially offset by higher prices for specialty chemicals (excluding coatings), agricultural chemicals and inorganic chemicals. Prices for consumer products were flat. Prices were lower by 5.2% compared to last December. Feedstock prices fell 1.9% during the month, but were off 33.5% Y/Y.
Note On the Color Codes
Banner colors reflect an assessment of the current conditions in the overall economy and the business chemistry of chemistry. For the overall economy we keep a running tab of 20 indicators. The banner color for the macroeconomic section is determined as follows:
Green – 13 or more positives
Yellow – between 8 and 12 positives
Red – 7 or fewer positives
There are fewer indicators available for the chemical industry. Our assessment on banner color largely relies upon how chemical industry production has changed over the most recent three months.
For More Information
ACC members can access additional data, economic analyses, presentations, outlooks, and weekly economic updates through ACCexchange.
In addition to this weekly report, ACC offers numerous other economic data that cover worldwide production, trade, shipments, inventories, price indices, energy, employment, investment, R&D, EH&S, financial performance measures, macroeconomic data, plus much more. To order, visit http://store.americanchemistry.com/.
Every effort has been made in the preparation of this weekly report to provide the best available information and analysis. However, neither the American Chemistry Council, nor any of its employees, agents or other assigns makes any warranty, expressed or implied, or assumes any liability or responsibility for any use, or the results of such use, of any information or data disclosed in this material.
Contact us at ACC_EconomicsDepartment@americanchemistry.com.


