Running tab of macro indicators: 7 out of 20
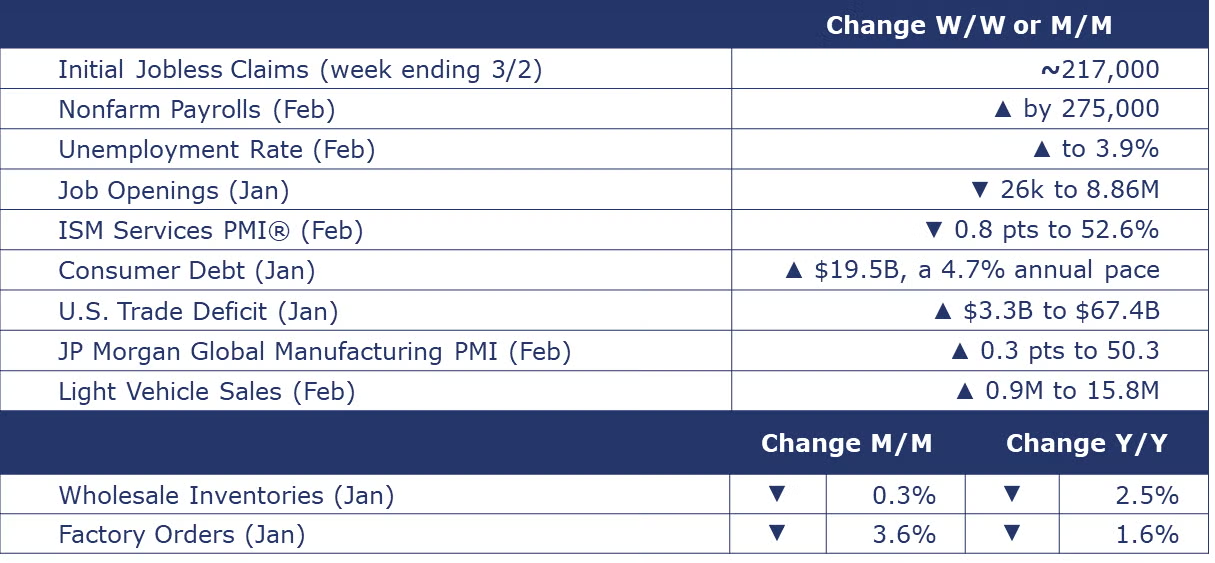
The number of new jobless claims remained unchanged at 217,000 for the week ending March 2. Continuing claims increased by 8,000 to 1.91 million, and the insured unemployment rate for the week ending February 24 was unchanged at 1.3%.
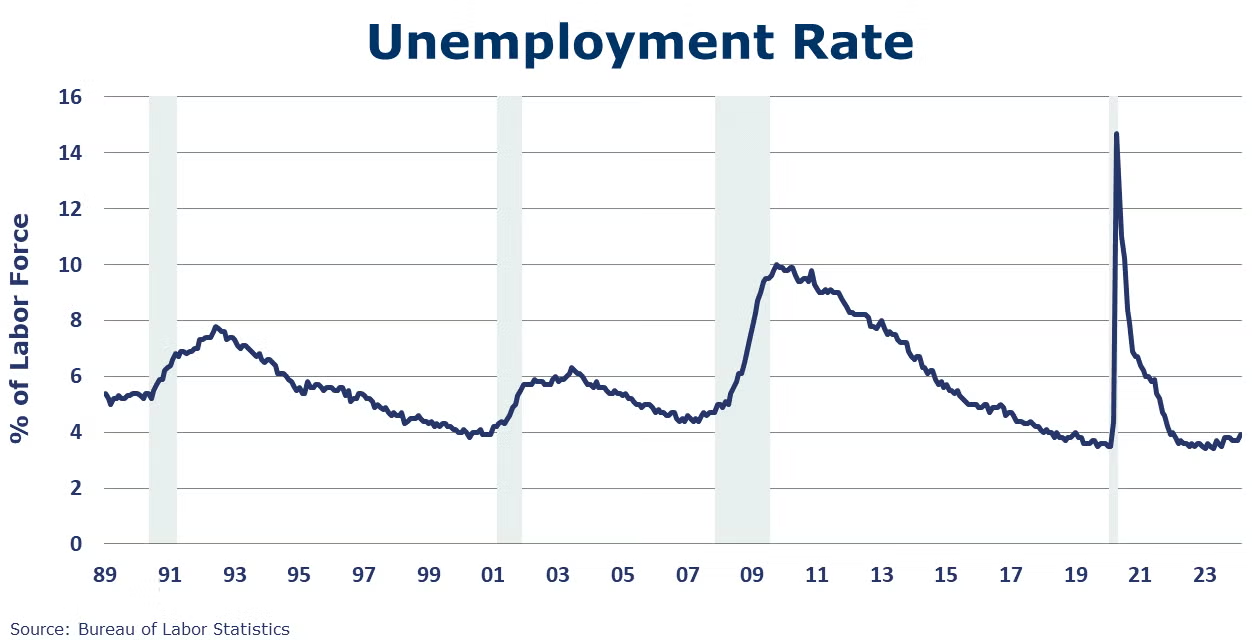
Nonfarm payrolls rose by 275,000 in February, higher than the average monthly gain of 230,000 over the prior 12 months. Job gains occurred in health care, in government, in food services and drinking places, in social assistance, and in transportation and warehousing. Overall manufacturing employment was stable (down just 4,000). Average hourly earnings held steady through February (rising 5 cents to $34.57) and have grown 4.3% over the year. The unemployment rate rose by 0.2 percentage points to 3.9%, reflecting an increase in the number of unemployed people (6.5 million).
The U.S. labor market has cooled steadily and the JOLTS data for January showed little change in the number of job openings, new hires, and separations. Jobs openings were roughly stable in January, having eased from a series high of 12.2 million openings in March 2022. New hires were also little changed. Separations held steady with the quits rate remaining low at 2.1% which suggests workers are less willing and/or able to leave their jobs. Layoffs were down 2.2% in January to a level down 15.8% Y/Y. There were 1.45 job openings per unemployed person in January, up from 1.42 in December, far lower than the 1.96 rate last December.
U.S. consumer credit accelerated in January, growing at a 4.7% annual rate (up from a 0.2% rate in December). Total consumer credit outstanding rose by $19.5 billion in January, more than expected. Revolving credit (credit cards, etc.) increased at a 7.6% pace while non-revolving credit (auto loans, student loans, etc.) increased at a 3.6% pace.
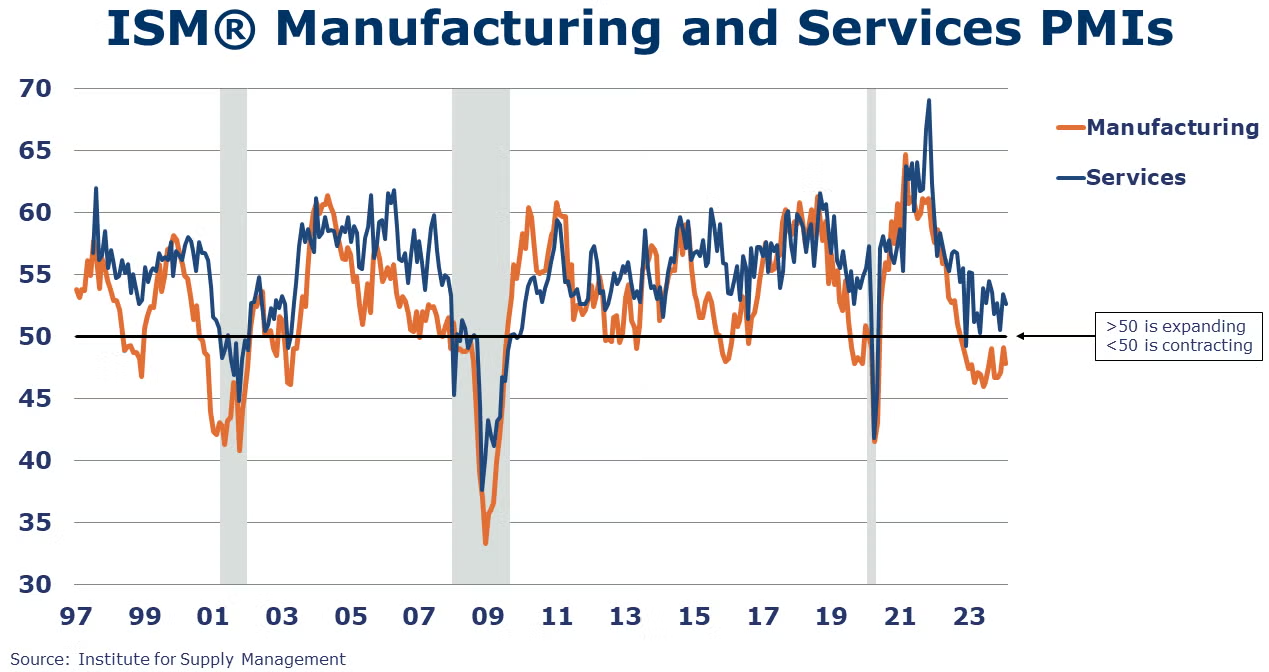
The ISM Services PMI® declined 0.8 percentage points to 52.6%, a reading indicating expansion in the services sector of the economy. The expansionary reading was the 14th consecutive. The index has pointed to expansion 44 of the last 45 months. The report about February included faster growth of new orders and business activity, contracting in employment and inventories.
U.S. factory orders dropped by 3.6% in January. The decline largely reflects a drop in nondefense aircraft. Core business orders (nondefense capital orders, excluding aircraft) were flat. Unfilled orders (a measure of the manufacturing pipeline) had a 0.2% gain. Manufacturing shipments were down 1.0%. Inventories were down slightly (-0.1%), continuing a three-month period of flat growth. The inventories-to-shipments ratio for the broader manufacturing sector was up slightly to 1.50, a fourth consecutive month of relative stability.
Wholesalers’ sales fell 1.7% to $657 billion in January, a level down 1.5% Y/Y. Inventories declined 0.3% to $895 billion, down 2.5% Y/Y. The inventory-to-sales ratio was 1.36, compared to 1.38 a year ago.
Light vehicle sales increased by 0.9 million to a 15.8 million seasonally adjusted annual rate (SAAR) in February, with increases in both the passenger car and light truck (including SUVs and minivans) categories. The share of “light trucks” is at 80% and has been steadily increasing for decades.
The U.S. deficit in goods and services trade widened by $3.3B to $67.4B in January as the goods deficit rose and the services surplus declined. U.S. goods imports and exports rose in January. Goods exports were up in autos and parts, consumer goods, and capital goods. Capital goods exports were the highest on record. Exports of industrial supplies and materials declined, reflecting drops in crude and fuel oil. Goods imports rose in capital goods and autos and parts to record highs while imports of crude oil and consumer goods declined.
J.P. Morgan’s Global Manufacturing PMI® rose 0.3 points to 50.3 in February, indicating global manufacturing expansion for the first time in 18 months. The readings for output and new orders rose. New export orders continued to decline. Sentiment was close to January’s nine-month high, and growth is expected in future output. Employment contracted at a slower rate. Fourteen of the 29 countries tracked saw expansion in output.
Fed Beige Book
A compilation of anecdotal information on the regional economies in the 12 districts, the Beige Book is published eight times per year. Interesting excerpts follow here:
- Overall economic activity increased slightly with most Districts report stability to modest growth.
- Employment rose at a slight to modest pace in most Districts. Overall, labor market tightness eased further, with nearly all Districts highlighting some improvement in labor availability and employee retention.
- Consumer spending softened, especially on retail goods. Consumers appear increasingly price-sensitive and shifting away from discretionary goods spending. Spending was also muted in leisure services like restaurants and hotels.
- Manufacturing activity was stable and supply bottlenecks normalized further.
- In real estate, demand seemed to be picking up residential due to some moderation in mortgage rates. Limited inventories continue to hinder actual sales, however. Commercial real estate activity was weak, especially in office space. There were some reports of robust demand for new data centers, industrial and manufacturing spaces, and large infrastructure projects.
- Price pressures persisted, but several Districts reported some degree of moderation in inflation. Contacts highlighted increases in freight costs. Businesses found it harder to pass through higher costs to their customers, who became increasingly sensitive to price changes. The cost of many manufacturing and construction inputs, such as steel, cement, paper, and fuel, reportedly fell in recent weeks.
- The outlook for future economic growth remained generally positive, with expectations for stronger demand and less restrictive financial conditions over the next 6 to 12 months.

Oil prices declined over the week. U.S. natural gas prices held steady compared to the prior at a level well-below a year ago. EIA reported that working gas in storage declined by 40 Bcf from the previous week. The combined oil and gas rig count rose by 2 to 625.
Indicators for the business of chemistry bring to mind a red banner.
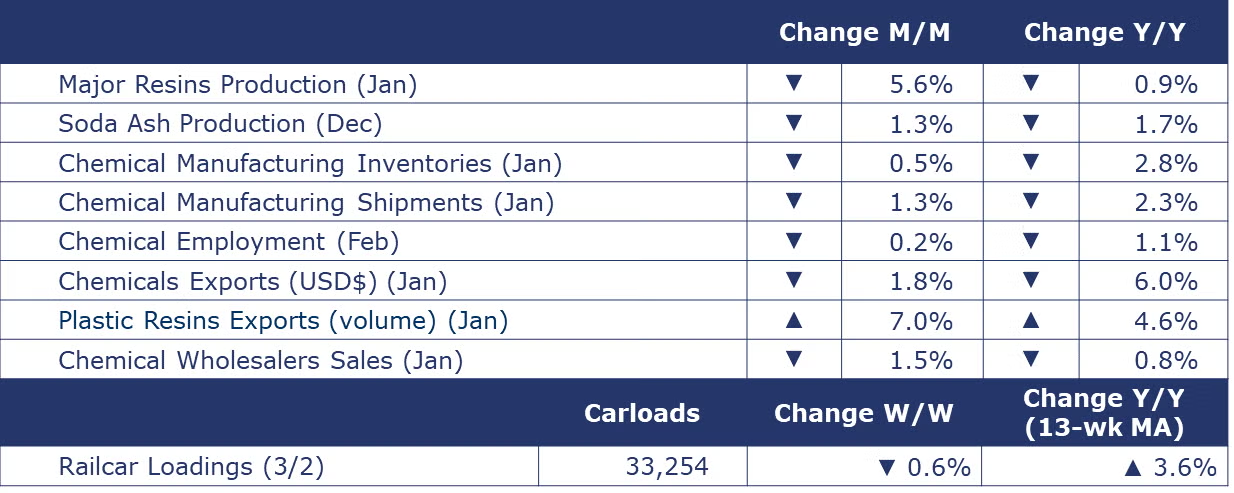
According to data released by the Association of American Railroads, chemical railcar loadings were down to 33,254 for the week ending March 2. Loadings were up 3.6% Y/Y (13-week MA), up (3.9%) YTD/YTD and have been on the rise for 6 of the last 13 weeks.
In the Fed Beige Book, it was noted that chemicals production declined slightly in the Chicago District, with lower demand from the construction, mining, and agriculture sectors. In Texas, new orders for basic chemicals and plastics ticked up slightly in January, while petrochemical manufacturers noted sluggish industrial demand, stemming from weakness in demand for construction-related products and aluminum. Utilization rates dipped as refineries along the Gulf Coast experienced unexpected outages during the reporting period.
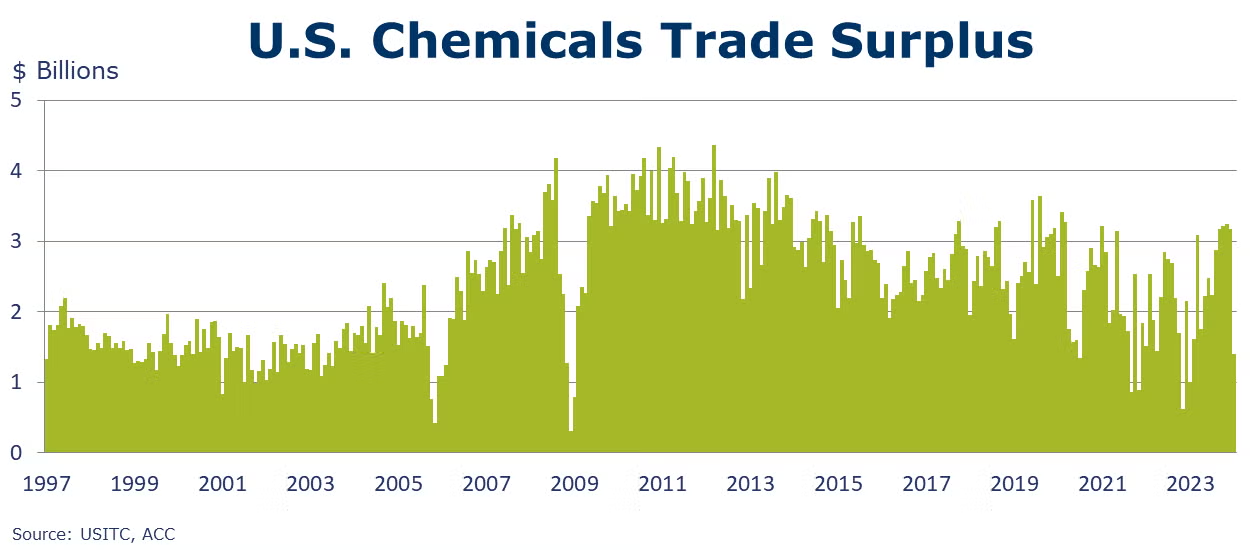
U.S. exports of chemicals declined 1.8% in January to a level 6.0% lower Y/Y. Gains in plastic resins exports were offset by declines in other categories. Plastics resin exports were up 7.6% on a USD$ basis and up 7.0% in volume terms to 2.0 million metric tons in January. Compared to levels last year, plastic resin exports were 4.7% lower on a USD$ basis but up 4.6% in volume terms. Chemical imports were up 15.7% in January but were 9.7% lower Y/Y. Chemical imports rose in all categories in January led by a 21.9% gain in petrochemicals and a 19.3% gain in specialties. On a Y/Y basis, however, imports of petrochemicals were down 13.4% and specialties were down 9.8%. The U.S. trade surplus in chemicals narrowed notably given the large gains in petrochemical and specialty chemicals imports.
Chemical and pharmaceutical industry employment fell by 2,100 jobs in February as a gain in production jobs was more than offset by a decline in supervisory and nonproduction jobs. The average workweek rose slightly from 40.5 hours to 40.6 hours. Average hourly earnings were up 6.8% Y/Y to $30.46.
U.S. production of major plastic resins totaled 8.0 billion pounds during January 2024, down 5.6% compared to the prior month, and down 0.9% Y/Y, according to ACC statistics. Sales and captive (internal) use of major plastic resins totaled 8.4 billion pounds up 2.9% M/M and up 8.3% Y/Y.
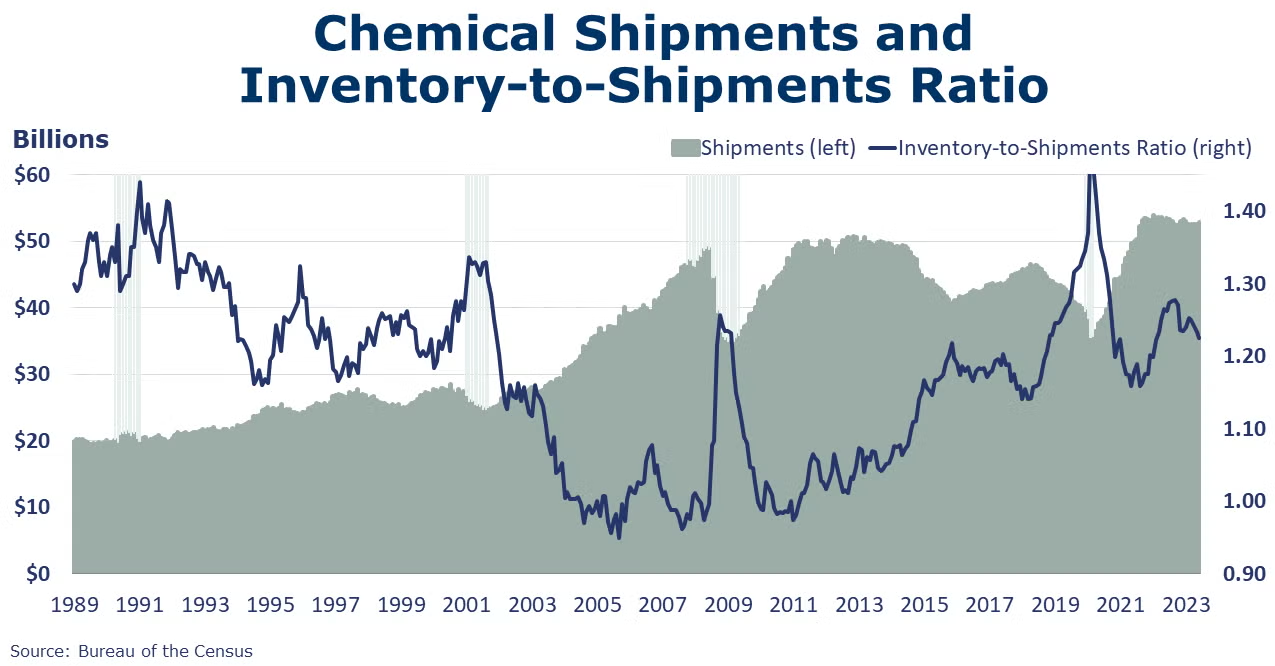
Chemical shipments fell by 1.3% in January following several months of gains. Shipments declined in agricultural chemicals, coatings and adhesives and all other chemicals. Chemical inventories fell by 0.5% as a buildup in agricultural chemicals was offset by declines in other chemicals. Compared to a year ago, shipments were 2.3% lower and inventories were down 2.8% Y/Y. The inventories-to-shipments ratio nudged up from 1.22 to 1.23 in January. A year ago, the ratio was 1.24.
Chemical wholesalers’ sales declined 1.5% in January to a level down 0.8% Y/Y. Inventories were down 2.7% to a level down 15.5% Y/Y. The chemicals wholesalers’ inventories-to-sales ratio continues to move toward 1.00. It was 1.03 in January, down from 1.21 a year ago.
The U.S. Geological Survey reported that monthly production of soda ash in December was 952 thousand tons, down 1.3% compared to the previous month and down 1.7% Y/Y. Stocks fell 21.3% over November to 251 thousand tons at the end of the month, an 8-day supply. Ending stocks were down 31.0% Y/Y.
Note On the Color Codes
Banner colors reflect an assessment of the current conditions in the overall economy and the business chemistry of chemistry. For the overall economy we keep a running tab of 20 indicators. The banner color for the macroeconomic section is determined as follows:
Green – 13 or more positives
Yellow – between 8 and 12 positives
Red – 7 or fewer positives
There are fewer indicators available for the chemical industry. Our assessment on banner color largely relies upon how chemical industry production has changed over the most recent three months.
For More Information
ACC members can access additional data, economic analyses, presentations, outlooks, and weekly economic updates through ACCexchange.
In addition to this weekly report, ACC offers numerous other economic data that cover worldwide production, trade, shipments, inventories, price indices, energy, employment, investment, R&D, EH&S, financial performance measures, macroeconomic data, plus much more. To order, visit http://store.americanchemistry.com/.
Every effort has been made in the preparation of this weekly report to provide the best available information and analysis. However, neither the American Chemistry Council, nor any of its employees, agents or other assigns makes any warranty, expressed or implied, or assumes any liability or responsibility for any use, or the results of such use, of any information or data disclosed in this material.
Contact us at ACC_EconomicsDepartment@americanchemistry.com.


