Running tab of macro indicators: 10 out of 20
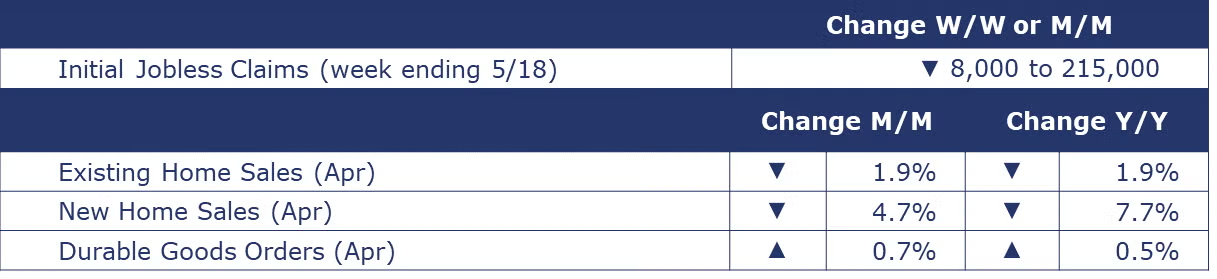
The number of new jobless claims fell by 8,000 to 215,000 during the week ending May 18. Continuing claims increased by 8,000 to 1.794 million, and the insured unemployment rate for the week ending May 11 was unchanged at 1.2%.

Existing home sales fell 1.9% in April to a 4.14 million annual pace which was off 1.9% Y/Y. Sales were down in every U.S. region. Housing inventories rose over April to a 3.5-month supply which was up from 3.0-months a year ago. The gains in inventory are happening at the upper-end of the market in higher priced homes. The median sales price was up 5.7% Y/Y to $407,600 in April.
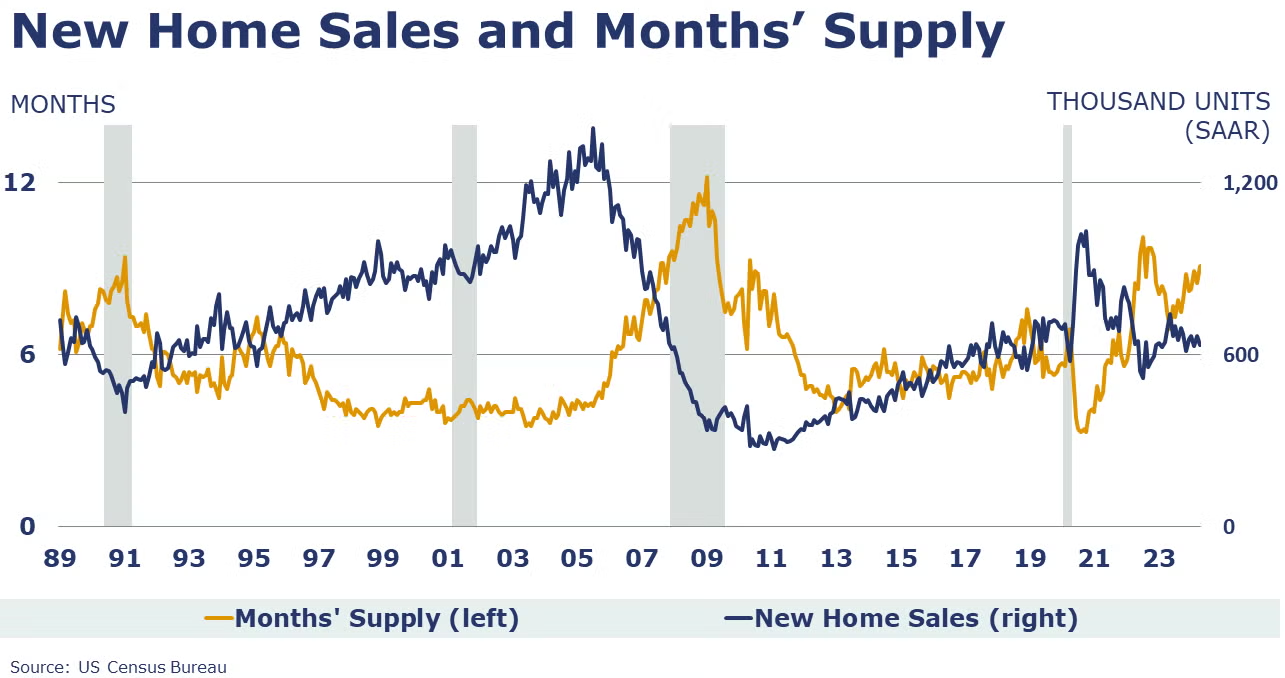
New home sales fell 4.7% to a 634,000 seasonally adjusted annual rate in April. The number of unsold homes available for sale rose 2.1% to 480,000, a high. That inventory represented a 9.1-month supply at the current sales rate. That was down from an 8.5-month supply in March, but up from 7.5 months a year ago. The median sales price of new homes sold in April was $433,500, down 1.4% from March and up 3.9% Y/Y.
Durable goods orders continued to expand at a decelerating pace in April, rising 0.7%. Excluding defense, new orders were virtually unchanged. Transportation equipment led the April gain with increases in new orders of autos and parts and defense aircraft. Orders were also higher for computers and electronics (including semiconductors), primary metals and fabricated metal products, and machinery. Orders for core business goods (nondefense capital goods excluding aircraft) rose by 0.3%. Compared to a year ago, headline orders were up 0.5% while core business orders were up by 1.2%.
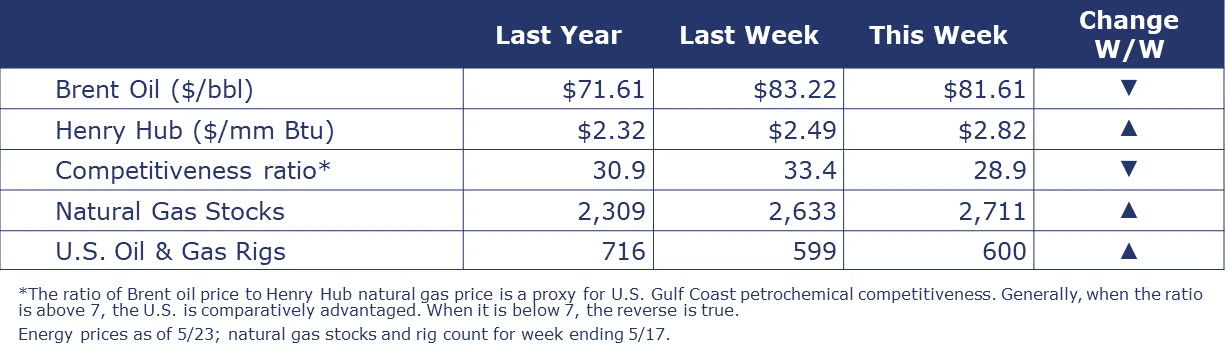
Oil prices declined over the past week while U.S. natural gas prices continued to rise with building summer heat (and cooling demand) starting in parts of the country. The combined oil and gas rig count rose by one to 600 which was lower compared to 716 a year ago.
Indicators for the business of chemistry bring to mind a yellow banner.

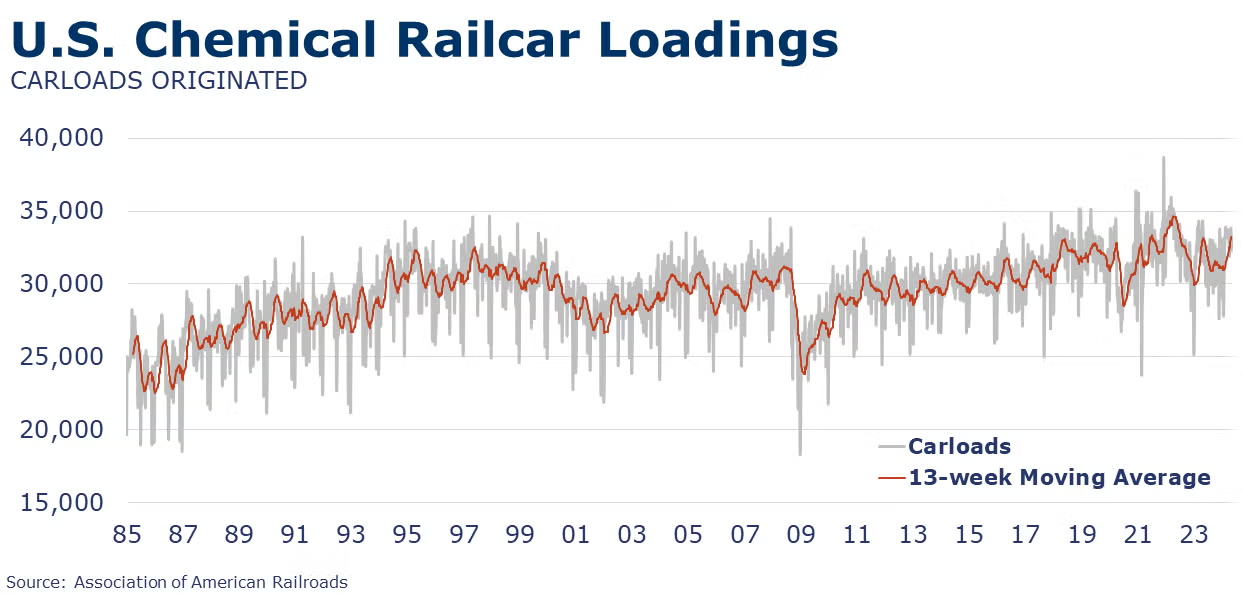
According to data released by the Association of American Railroads, chemical railcar loadings were down to 32,294 for the week ending May 18. Loadings were up 0.4% Y/Y (13-week MA), up (3.9%) YTD/YTD and have been on the rise for 6 of the last 13 weeks.
Note On the Color Codes
Banner colors reflect an assessment of the current conditions in the overall economy and the business chemistry of chemistry. For the overall economy we keep a running tab of 20 indicators. The banner color for the macroeconomic section is determined as follows:
Green – 13 or more positives
Yellow – between 8 and 12 positives
Red – 7 or fewer positives
There are fewer indicators available for the chemical industry. Our assessment on banner color largely relies upon how chemical industry production has changed over the most recent three months.
For More Information
ACC members can access additional data, economic analyses, presentations, outlooks, and weekly economic updates through ACCexchange.
In addition to this weekly report, ACC offers numerous other economic data that cover worldwide production, trade, shipments, inventories, price indices, energy, employment, investment, R&D, EH&S, financial performance measures, macroeconomic data, plus much more. To order, visit http://store.americanchemistry.com/.
Every effort has been made in the preparation of this weekly report to provide the best available information and analysis. However, neither the American Chemistry Council, nor any of its employees, agents or other assigns makes any warranty, expressed or implied, or assumes any liability or responsibility for any use, or the results of such use, of any information or data disclosed in this material.
Contact us at ACC_EconomicsDepartment@americanchemistry.com.

