Running tab of macro indicators: 9 out of 20
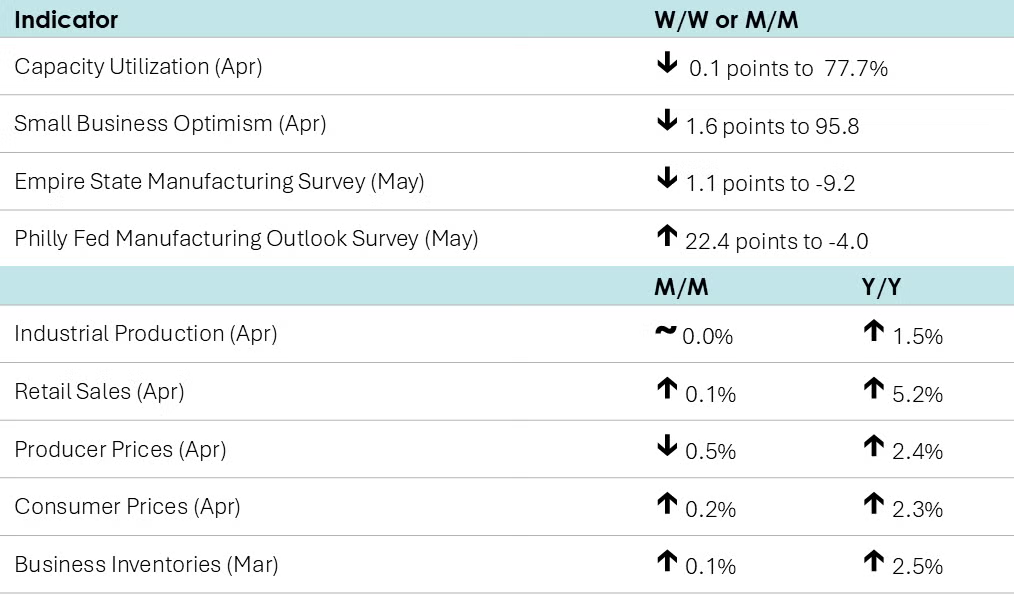
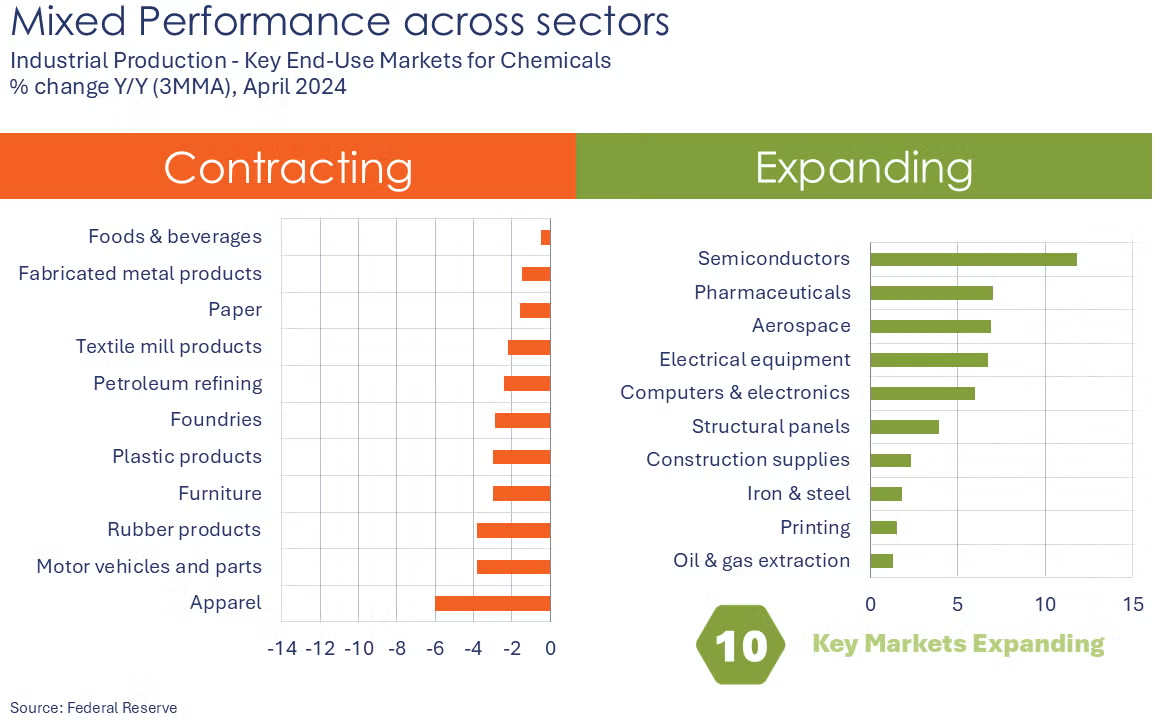
Output of the industrial sector (which directly purchases more than 80% of chemistry products) was flat in April, following a decline in March. While utility output expanded, mining and manufacturing production declined. Manufacturing output, which had expanded during four of the previous five months, fell by 0.4%. The largest output declines were in motor vehicles, nonmetallic mineral products, apparel & leather and food, beverage & tobacco. Production in several sectors gained, including wood products, fabricated metal products, and aerospace. Capacity utilization eased slightly from 77.8% in March to 77.7% in April, the same rate as a year ago. Over the past year, overall industrial capacity has grown by 1.4%.
An early look into May suggests manufacturing remained weak in some parts of the country. Business activity continued to decline modestly in New York State, according to the NY Fed’s Empire State Manufacturing Survey and firms expect conditions to worsen in the months ahead. The Philadelphia Fed’s Manufacturing Business Outlook Survey showed that manufacturing activity remained weak, but that expectations were sharply higher six months ahead.
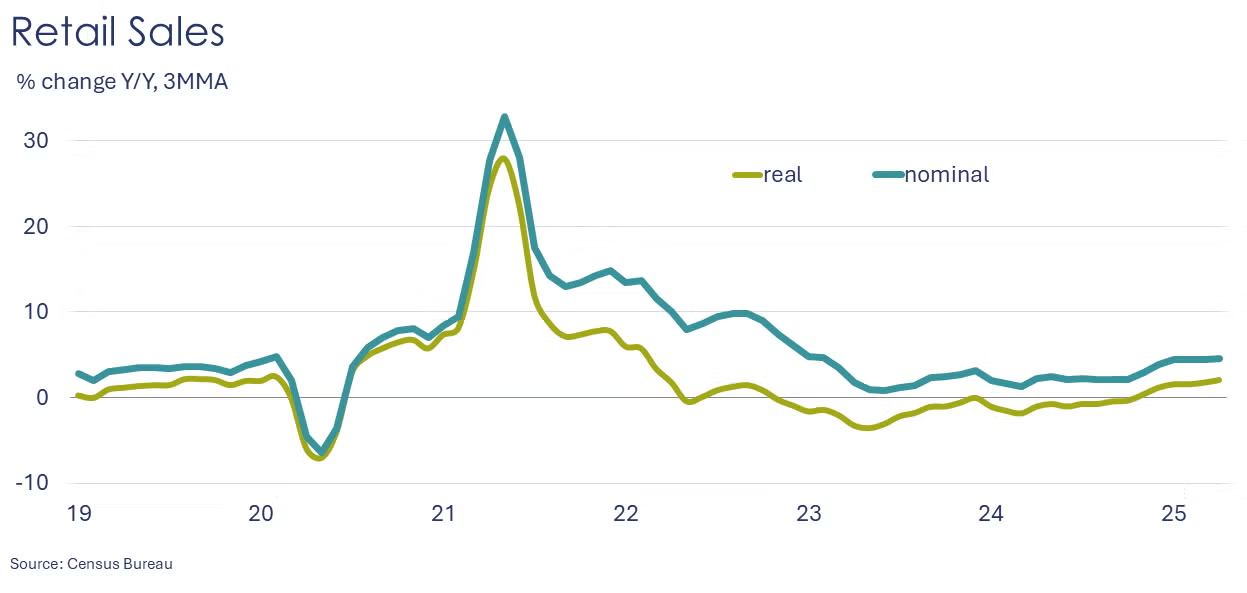
Following a surge in March led by consumers stocking up to avoid tariffs, retail and food service sales edged only slightly higher in April, up 0.1%. Sales were higher at restaurants, building material & garden centers, furniture stores, and electronics and appliance stores. Nonstore retail sales (i.e., online platforms) also rose modestly. Offsetting those gains were lower sales at motor vehicle & parts dealers, grocery stores, gas stations, sporting good and hobby stores, general merchandise stores, and health & beauty stores. Compared to a year ago, retail sales were up 5.2%.
Consumer prices moved 0.2% higher in April. Food prices moved lower, led by a decline in the price of chicken eggs. Energy prices were higher as natural gas prices rose. Excluding food and energy, core consumer prices were 0.2% higher. Compared to a year ago, headline consumer inflation was up by 2.3%, the slowest pace since February 2021 before the post-lockdown supply chain issues triggered sharply higher inflation. Annual growth in core consumer prices was steady at 2.8% Y/Y.
Reflecting prices at the wholesale level, producer prices fell 0.5% in April, largely due to lower prices for services, including trade margins and fees for private capital investment services. Core goods prices continued to advance, however, up by 0.4% during the month. Within the details, prices for materials for durable manufacturing were up 2.2%, following a 3.0% gain in February.
Homebuilder confidence fell sharply in May as interest rates moved higher and the economic outlook remained uncertain. The NAHB housing market index fell six points to 34 with deterioration across all three components - current sales, buyer traffic, and expectations.
Combined business inventories edged slightly higher in March (up by 0.1%), but couldn’t keep up with another solid expansion (0.7%) in sales. Compared to a year ago, inventories were up 2.5% Y/Y while sales were ahead by 4.5% Y/Y. The inventories-to-sales ratio edged lower to 1.34. A year ago, it was 1.37.
The NFIB’s small business optimism index fell 1.6 points to 95.8 in April, the fourth consecutive decline. The decline was led by deteriorating economic expectations and a drop in labor demand.
Indicators for the business of chemistry suggest a yellow banner.
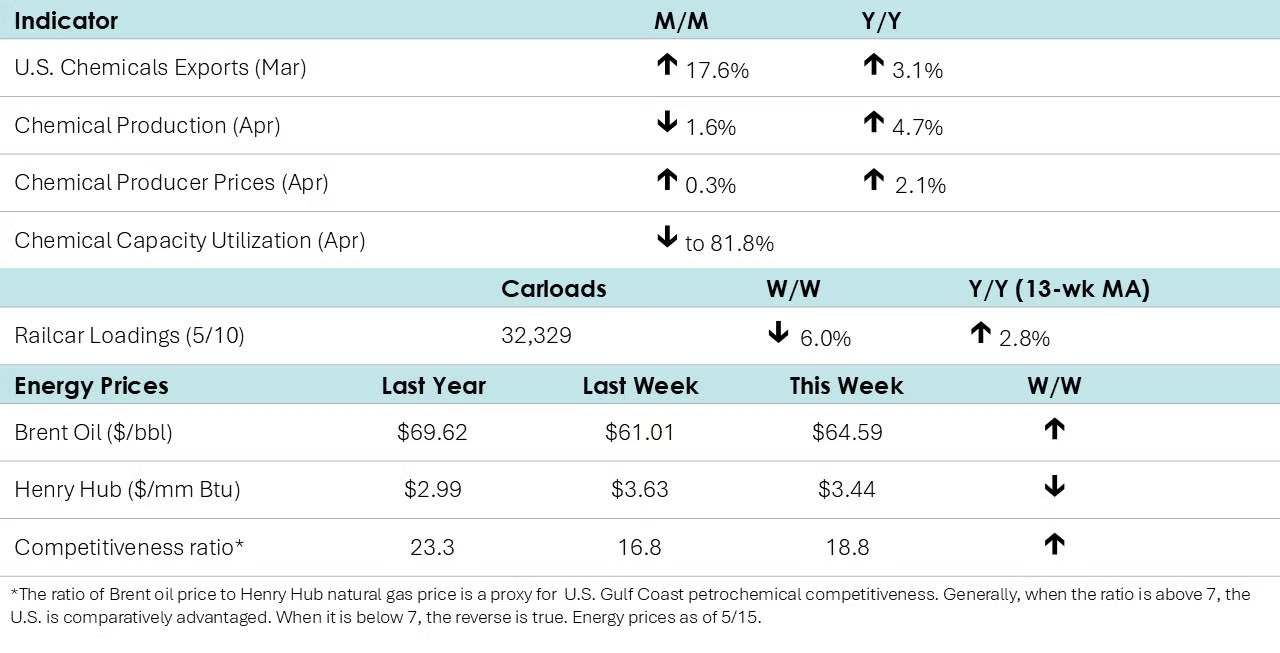
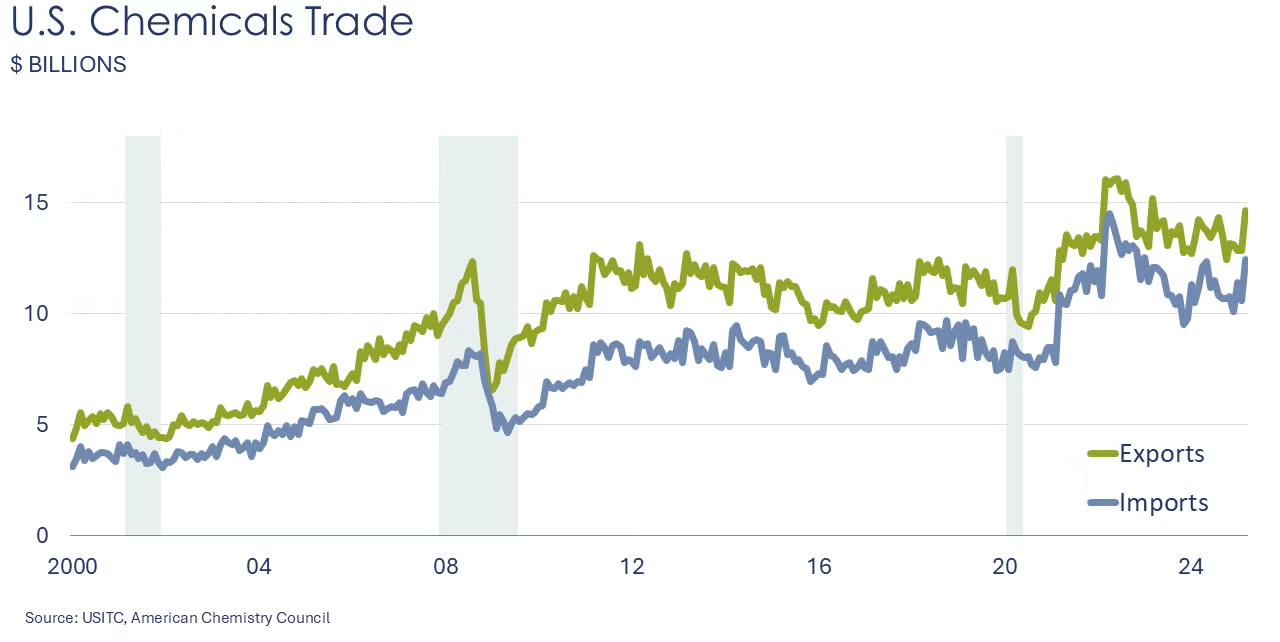
After three months of consecutive decline, U.S. chemical exports rose by an impressive 17.6% in March as tariff-related uncertainties drove companies to front-load. All segments showed substantial double-digit gains, except synthetic rubber and consumer products, which grew by 8.9% and 7.5%, respectively. Chemical imports outgrew exports with a 23.8% gain in March. All segments recorded double-digit gains. Compared to a year ago, chemical exports were up 3.1% Y/Y while imports were ahead by 9.8% Y/Y. As imports grew faster than exports, the chemical trade surplus shrank from $2.4 billion in February to $2.2 billion in March.
U.S. plastic resin exports rose 14% in March to 2.36 million metric tons. Compared to a year ago, resin exports were up 0.9%.
Chemical production fell 1.6% in April, following revised flat growth in March. In April, output fell across all segments, except for production of organic chemicals which rose 1.6%. Compared to a year ago, chemical production was up 4.7% Y/Y. Capacity utilization fell to 81.8% in April.
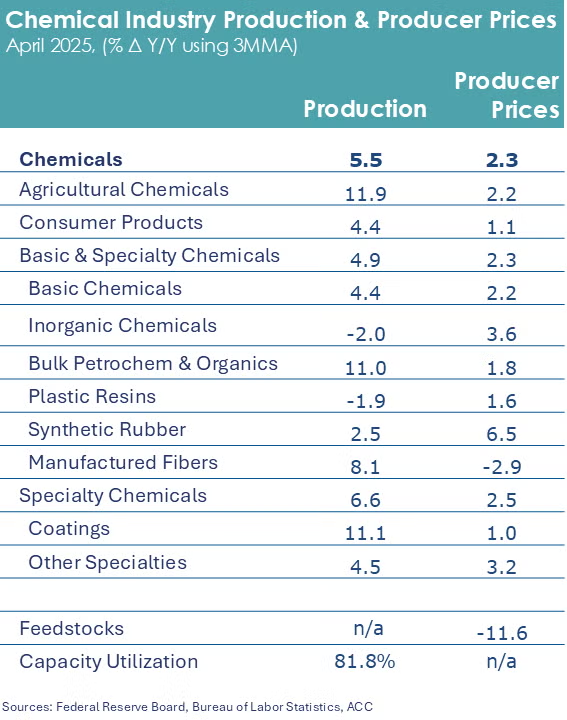
Producer prices for chemicals rose for a fourth consecutive month in April, up by 0.3%. Prices were higher across all major categories, except for synthetic rubber. Feedstock prices declined 3.8% in April. Compared to a year ago, chemical prices were up 2.1% Y/Y.
According to data released by the Association of American Railroads, chemical railcar loadings were down to 32,329 for the week ending May 10th. Loadings were up 2.8% Y/Y (13-week MA), up (2.0%) YTD/YTD and have been on the rise for seven of the last 13 weeks.
Energy Wrap-Up
- Oil prices were higher than a week ago, but down from earlier in the week on prospects of a U.S.-Iran nuclear deal.
- Natural gas prices eased slightly from a week ago.
- The combined oil & gas rig count fell by five to 575.
- Natural gas inventories rose by 110 BCF last week, the largest build this year.
Note On the Color Codes
Banner colors reflect an assessment of the current conditions in the overall economy and the business chemistry of chemistry. For the overall economy we keep a running tab of 20 indicators. The banner color for the macroeconomic section is determined as follows:
Green – 13 or more positives
Yellow – between 8 and 12 positives
Red – 7 or fewer positives
There are fewer indicators available for the chemical industry. Our assessment on banner color largely relies upon how chemical industry production has changed over the most recent three months.
For More Information
ACC members can access additional data, economic analyses, presentations, outlooks, and weekly economic updates through ACCexchange.
In addition to this weekly report, ACC offers numerous other economic data that cover worldwide production, trade, shipments, inventories, price indices, energy, employment, investment, R&D, EH&S, financial performance measures, macroeconomic data, plus much more. To order, visit the ACC Store.
Every effort has been made in the preparation of this weekly report to provide the best available information and analysis. However, neither the American Chemistry Council, nor any of its employees, agents or other assigns makes any warranty, expressed or implied, or assumes any liability or responsibility for any use, or the results of such use, of any information or data disclosed in this material.
Contact ACC's Economics & Data Analytics department via email.

