Running tab of macro indicators: 18 out of 20
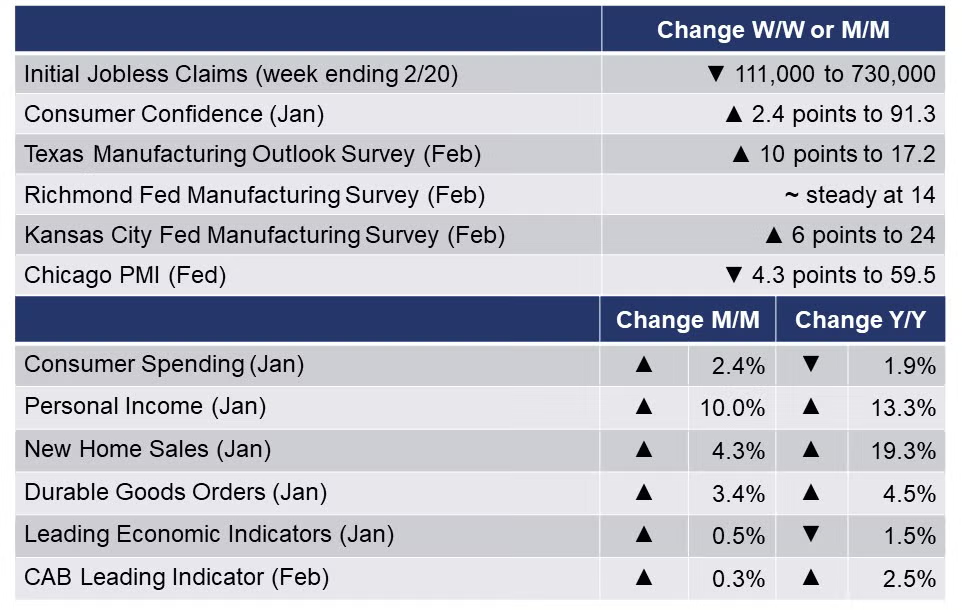
The number of new jobless claims fell by 111,000 to 730,000 during the week ending 20 February. Continuing claims fell by 101,000 to 4.419 million and the unemployment rate for the week ending 13 February eased 0.1 percentage points to 3.1%. The data are skewed by the winter storm.
Real gross domestic product (GDP) increased at an annual pace of 4.1% in the 4th quarter, a pace slightly higher than the previous advance estimate. In the 3rd quarter, real GDP increased 33.4%. This current GDP estimate is based on more complete source data than were available for the “advance” estimate issued last month. With the second estimate, upward revisions to residential fixed investment, private inventory investment, and state and local government spending were partly offset by a downward revision to consumer spending.
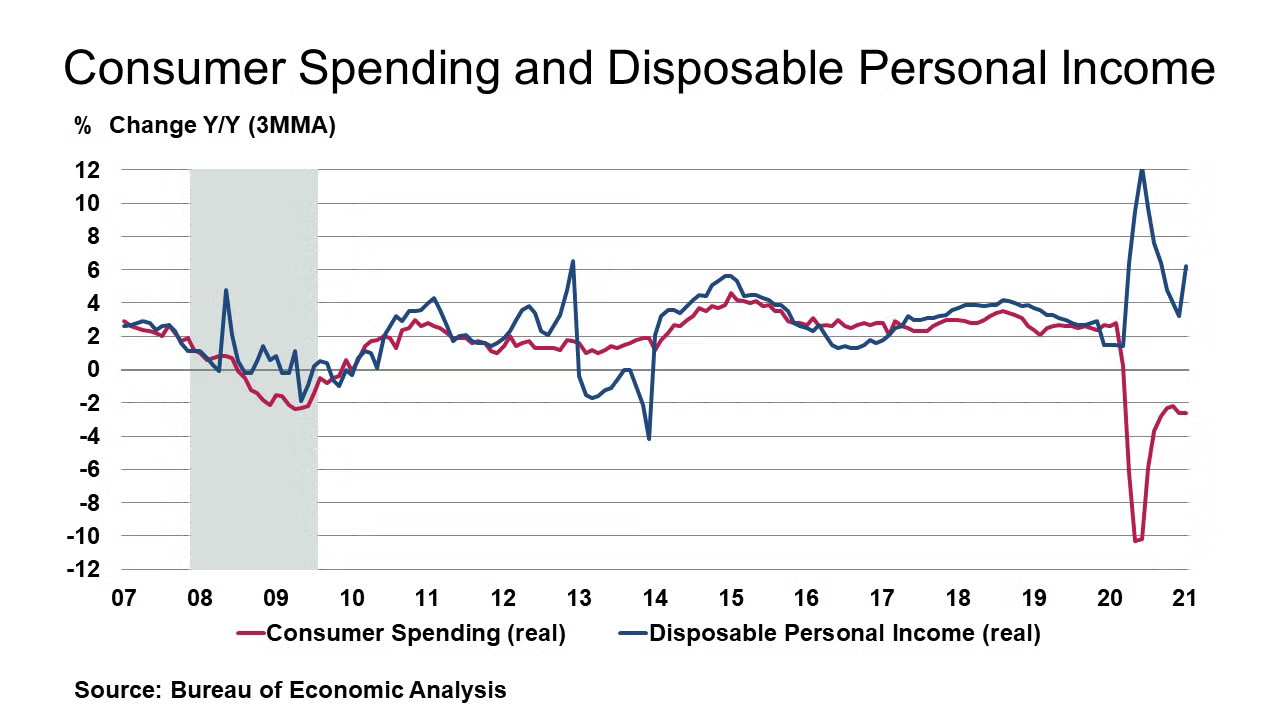
Fueled by additional stimulus, consumer spending rose by 2.4% in January, following declines in November and December. Personal income rose by 10.0% as a round of stimulus checks were sent to households at the beginning of the month. Compared to last January, consumer spending remained off by 1.9%, but income was up 13.3%. As spending hasn’t kept pace with income gains due to sharply weaker spending on services, the savings rate has expanded and was 20.5% in January. The Fed’s preferred inflation measure, the PCE deflator, continued to gain, up 1.5% Y/Y. Excluding food and energy prices, the PCE deflator was also up by 1.5% Y/Y. Both measures were up from a month ago.
Consumer confidence rose 2.4 points to 91.3 (where 1985=100) in February as consumers’ assessment of current economic conditions more than recovered January’s decline. Discernment of the economy’s prospects six months ahead, however, eased slightly.
New home sales rose by a higher than expected 4.3% in January. Sales increased across all regions, except the smaller Northeast market. The inventory of unsold homes at the end of January rose 2.7% and now represents a 4.0-month supply, slightly lower than the 4.1-month supply at the end of December, and considerably lower than the 5.0-month supply a year ago. Fueled by low mortgage rates and surging demand for housing due to pandemic trends for remote work, sales were up 19.3% Y/Y.
Durable goods orders increased 3.4% ($8.5 billion) to $256.6 billion in January; this was the ninth consecutive gain. Orders for non-defense capital goods excluding aircraft—a proxy for business investment—were more muted, a 0.5% gain. Large gains were made in primary metals, fabricated metal products, computers, aircraft, and electrical equipment, appliances, and components. Headline orders were up 4.5% Y/Y and core orders up 8.3% Y/Y. Shipments and order backlogs gained as well while inventories eased.
Prior to the winter storm that crippled the state last week, manufacturing conditions in Texas had improved markedly in February. The Dallas Fed’s Texas Manufacturing Outlook Survey index rose 10 points to 17.2 with gains in production, capacity utilization, new orders, and shipments. Looking ahead over the next six months, firms continued to become more optimistic about business conditions. The Richmond Fed reported that manufacturing activity continued to improve in the Fifth District during February. The composite index held steady at 14, as all components—shipments, new orders, and employment—remained firmly positive. Vendor lead time, which hit a 25- year-high of 39 in January, rose further to 46 in February. Firms also reported decreased inventory levels. Manufacturers were optimistic that conditions would improve in the coming months. The Kansas City Fed reported that Tenth District manufacturing activity climbed higher in February compared to a month ago (+6 points to +24) and expectations for future activity increased. Prices paid for raw materials continued to increase, reaching the second highest pace of growth in survey history. Prices for finished goods also grew more from a month ago and a year ago. The Chicago PMI showed a larger-than-expected slowdown in the pace of growth in Chicago-area manufacturing activity in the month of February. The Chicago business barometer dropped 4.3 points to 59.5 in February after its two-year high in January. The new orders index tumbled by 11 points to its lowest level since last August and production index also slumped, by 9.3 points. The Conference Board index of leading economic indicators (LEI) increased 0.5% in January to 110.3 (2016 = 100), following a 0.4% gain in December and a 0.9% gain in November. Seven of the 10 indicators making up the LEI expanded in January. While the pace of increase in the LEI has slowed since mid-year January’s gains were broad-based and suggest economic growth should improve gradually.
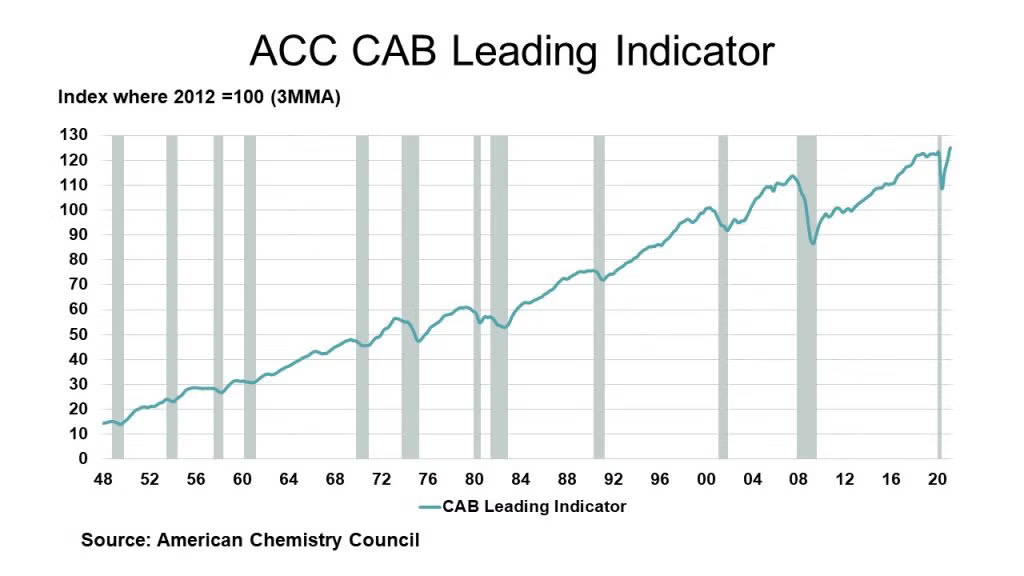
With insight into February and the effects of the winter storm, our CAB leading economic indicator rose 0.3% a slowdown from a 2.0% increase in January. Marking the number of positive contributors relative to the total number of indicators, the diffusion index eased to 77%. The CAB has four main components, each consisting of a variety of indicators: 1) production; 2) equity prices; 3) product prices; and 4) inventories and other indicators. In February, production-related indicators were positive. Trends in construction-related resins and related performance chemistry were solid. Resins and chemistry used in other durable goods were strong. Plastic resins used in packaging and for consumer and institutional applications were positive. Performance chemistry for industry was strong. U.S. exports were positive, while equity prices increased. Product and input prices were positive, as were inventory and other supply chain indicators. With 10 months of gains, the latest CAB reading is consistent with expansion in the U.S. economy.
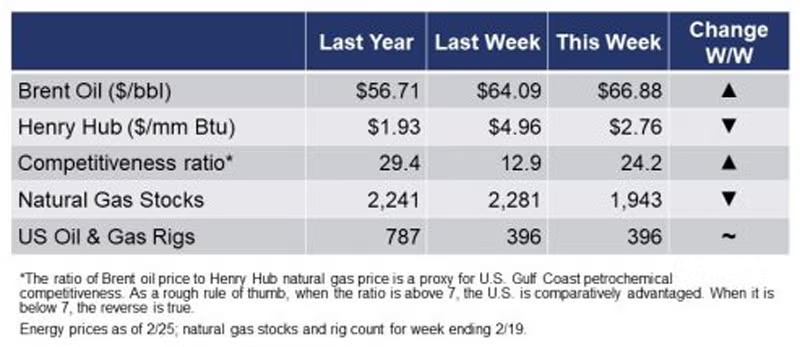
The rig count remained steady at 396 rigs during the week ending 19 February. The extremely cold temperatures last week caused a near-record 338 BCF withdrawal of natural gas inventories that pushed inventories below their five-year historic average. While oil prices continued to climb on last week’s production outages in the U.S. Gulf Coast, natural gas price recovered from last week’s demand-induced spikes.
For the business of chemistry, the indicators still bring to mind a green banner for basic and specialty chemicals.

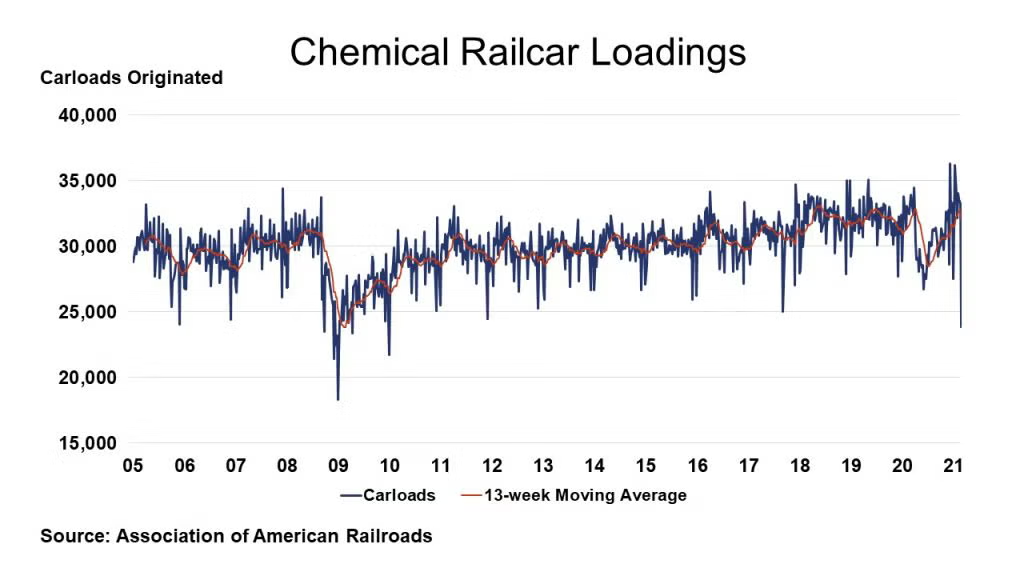
According to data released by the Association of American Railroads, chemical railcar loadings, the best ‘real time’ indicator of chemical industry activity, fell significantly—by 9,391 (28.2%)—to 23,864 railcars the week ending 20 February (week 7), a reflection of the widespread weather-related chemical plant shutdowns in the Gulf Coast. Loadings were down 28.3% Y/Y, down 0.9% YTD/YTD and the 13-week moving average, which is used to smooth out volatility, was up 1.1% compared to last year.
The Chlorine Institute (CI) reported that production of chlorine was 32,102 in January, down slightly (0.2%) over the previous month; YTD production was down 7.7% compared to January 2020. The output of co-produced caustic soda rose slightly (0.3%) to 34,166 compared to December and YTD production was down 8.5% Y/Y.
U.S. specialty chemicals market volumes started the year on a strong note, rising 1.2% in January, accelerating slightly from a 1.0% gain in December. Of the 28 specialty chemical segments we monitor, 19 expanded in January, off from 22 in December. Two segments were stable and seven declined. Thus, on a sequential (one-month change) basis, diffusion was 70%, off from 79% in December. Of the 19 segments rising in January, 12 (too many to mention) featured gains of 1.0% or more.
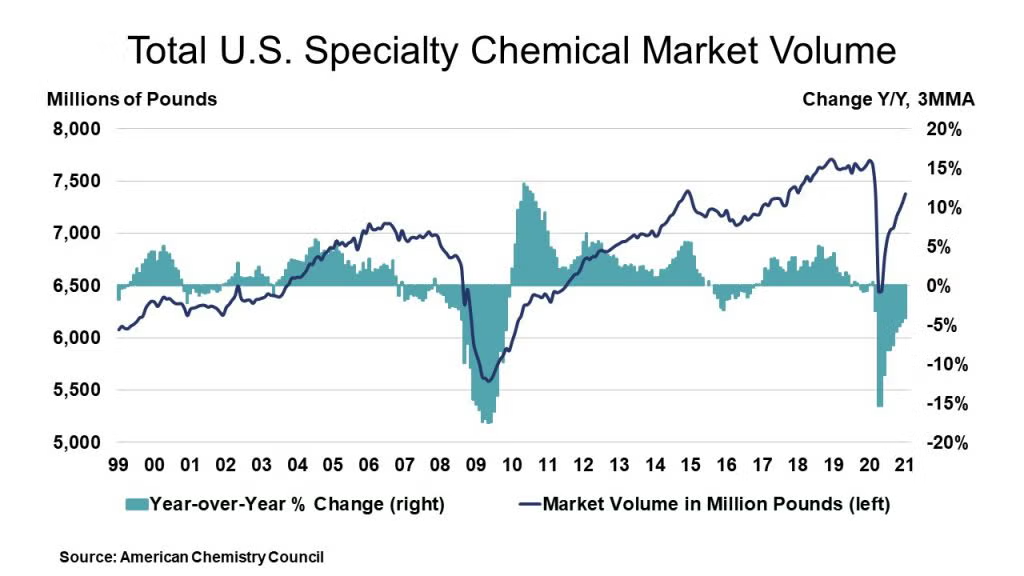
During January, overall specialty chemicals volumes were off 4.2% Y/Y, a slightly better comparison than in December. Volumes stood at 108.3% of their average 2012 levels in December. This is equivalent to 7.38 billion pounds (3.35 million metric tons). On a year-earlier basis, there were gains in six chemical segments: cosmetic additives, electronic chemicals, flavors & fragrances, food additives, plastic compounding, and water management chemicals. On a year-earlier basis, diffusion was 18% in January.
The U.S. Chemical Production Regional Index (U.S. CPRI), which is measured as a three month moving average (3MMA), rose by 0.8% in January following a 1.4% gain in December and a 1.1% increase in November. During January, chemical output expanded in nearly all regions. The largest gain was in the Gulf Coast, with smaller gains in the Midwest, Southeast, Ohio Valley, and Northeast regions. Output was flat in the Mid-Atlantic region and edged lower in the West Coast. Compared with January 2020, U.S. chemical production remained off by 0.6%, the twentieth consecutive month of Y/Y declines, but represents a continued improvement compared to earlier in the year. Chemical production remained lower than a year ago in all regions, except in the Gulf Coast region which was up 2.5% Y/Y.
Chemical production continued to expand in chlor-alkali, fertilizers, organic chemicals, synthetic rubber, plastic resins, manufactured fibers, industrial gases, and synthetic dyes & pigments. Production eased in coatings, adhesives, crop protection, consumer products, and other specialty chemicals.
As nearly all manufactured goods are produced using chemistry in some form, manufacturing activity is an important indicator for chemical demand. The manufacturing recovery continued for a sixth consecutive month in January, with overall factory activity up by 1.0% (on a 3MMA basis). The trend in production rose in many key chemistry end-use industries, with the strongest gains in food & beverages, appliances, motor vehicles, aerospace, construction supplies, fabricated metal products, iron & steel products, petroleum refining, oil & gas extraction, plastic products, structural panels, textile products, and furniture.
Note On the Color Codes
The banner colors represent observations about the current conditions in the overall economy and the business chemistry. For the overall economy we keep a running tab of 20 indicators. The banner color for the macroeconomic section is determined as follows:
Green – 13 or more positives
Yellow – between 8 and 12 positives
Red – 7 or fewer positives
For the chemical industry there are fewer indicators available. As a result we rely upon judgment whether production in the industry (defined as chemicals excluding pharmaceuticals) has increased or decreased three consecutive months.
For More Information
ACC members can access additional data, economic analyses, presentations, outlooks, and weekly economic updates through MemberExchange.
In addition to this weekly report, ACC offers numerous other economic data that cover worldwide production, trade, shipments, inventories, price indices, energy, employment, investment, R&D, EH&S, financial performance measures, macroeconomic data, plus much more. To order, visit http://store.americanchemistry.com/.
Every effort has been made in the preparation of this weekly report to provide the best available information and analysis. However, neither the American Chemistry Council, nor any of its employees, agents or other assigns makes any warranty, expressed or implied, or assumes any liability or responsibility for any use, or the results of such use, of any information or data disclosed in this material.
Contact us at ACC_EconomicsDepartment@americanchemistry.com
Upcoming Events of Interest
“JP Morgan: What’s Ahead in Chemicals” Webinar
Chris Power – Managing Director & Global Co-Head of Chemicals, JP Morgan Securities; Evan Junek – Managing Director, Corporate Finance Advisory, JP Morgan Investment Bank; and Brian Orkin – Investment Partner, Arsenal Capital (moderator)
4 March (11:00 am – 12:15 pm)
Chemical Marketing & Economics
www.cme-stem.org
“Discussion Group: Perspectives on China and the U.S. – What will Change?” Virtual Event
11 March (4:00 – 5:00 pm)
Société de Chimie Industrielle
www.societe.org

