Running tab of macro indicators: 16 out of 20
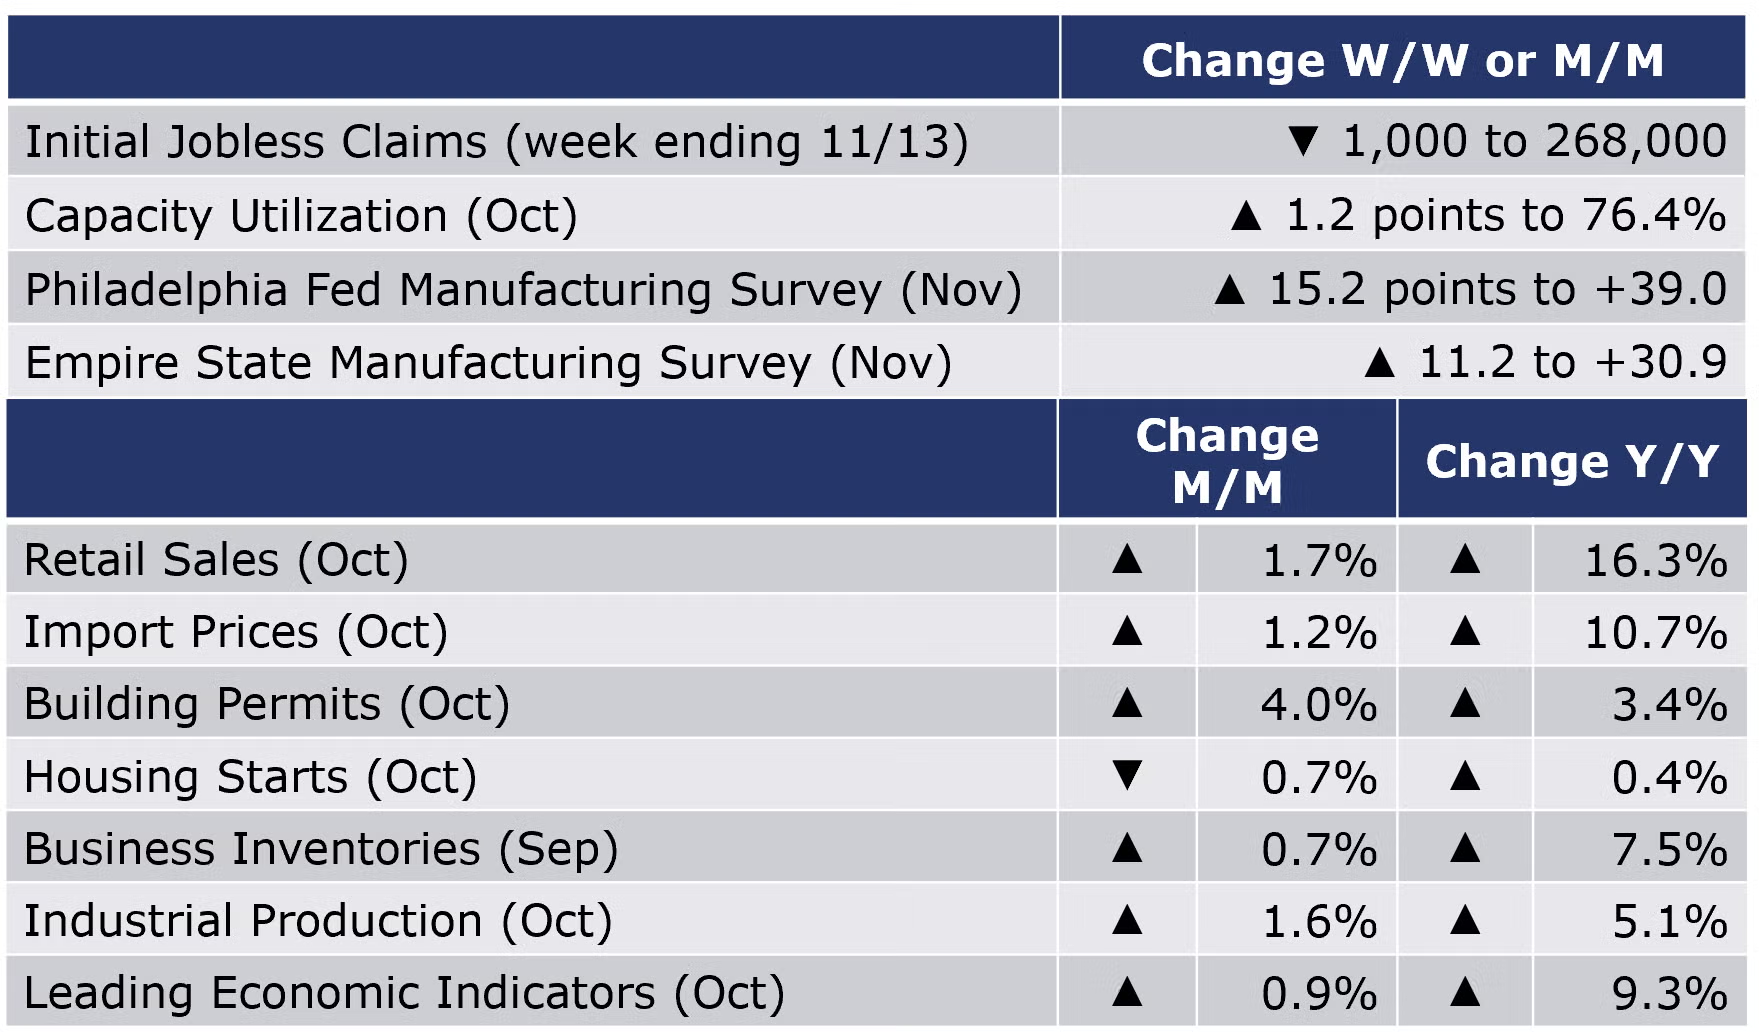
The number of new jobless claims fell by 1,000 to 268,000 during the week ending 13 November, the lowest since March 14, 2020. Continuing claims decreased by 129,000 to 2.08 million, and the insured unemployment rate for the week ending 6 November was steady at 1.5%.
Retail sales surged in October, up 1.7%. Retail sales posted strong gains in nearly all major categories, with the exception of clothing & accessory stores; health & personal care stores; and restaurants. The strongest gains were in gas station sales, electronics, building supplies, and online platforms. Sales at restaurants were flat. Compared to a year ago, retail sales were up 16.3%.
Combined business inventories rose by 0.7% in September with gains in wholesale and manufacturing inventories offset by declining inventories at retailers. Combined business sales rose by 0.9% with gains across all three segments. Compared to a year ago, business sales were up 15.5% while inventories were up 7.5% Y/Y. The inventories-to-sales ratio remained steady compared to August at 1.26, a level down from 1.35 last September.
Import prices rose by 1.2%, the fastest gain since May. The gain was led by an 8.6% increase in prices for imported fuels. Nonfuel import prices rose by 0.4%, the fastest pace since June. Export prices rose 1.5% with gains in both agricultural and non-agricultural exports. Compared to a year ago, import prices were ahead by 10.7% while export prices were up 18.0% Y/Y; both represent an acceleration compared to previous months.
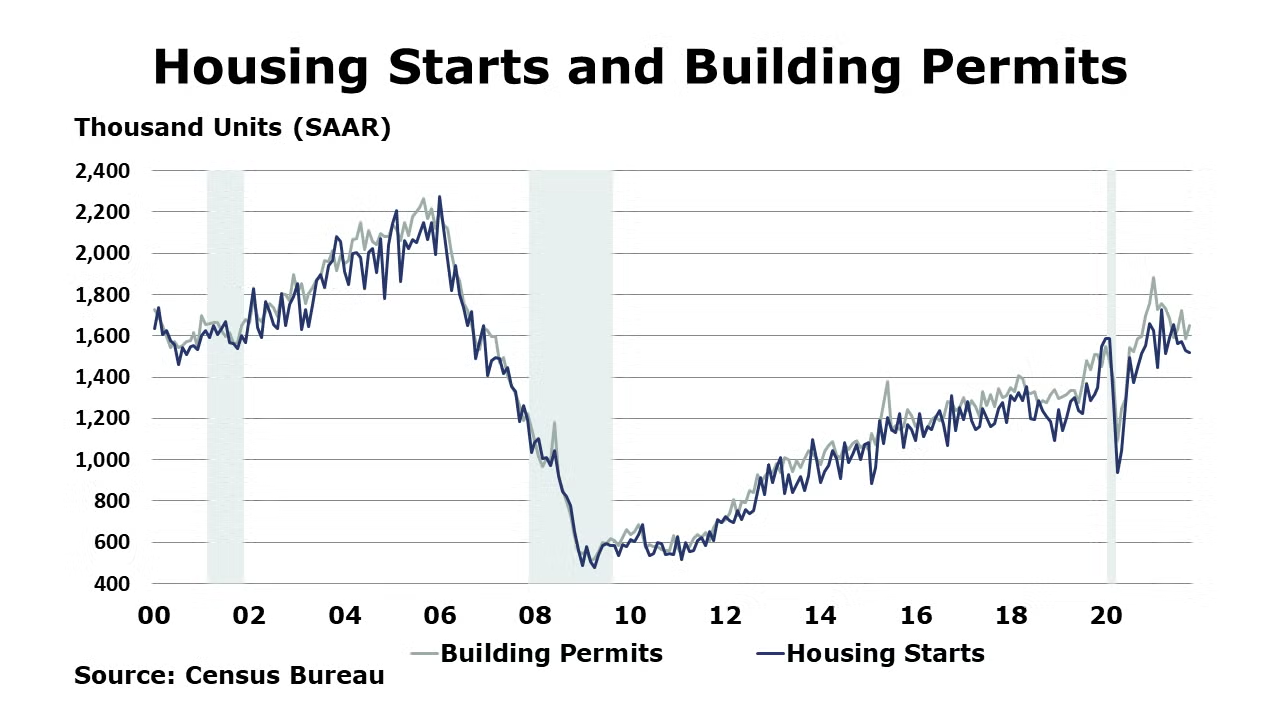
Reflecting labor and material shortages, housing starts slid lower by 0.7% in October compared to September, but 0.4% higher than October 2020. Forward-looking building permits rose by 4.0% compared to September, and 3.4% above October 2020. Separately, homebuilder sentiment edged higher in November (the third straight month) on strong consumer demand, as measured by the NAHB/Wells Fargo Housing Market Index (HMI).
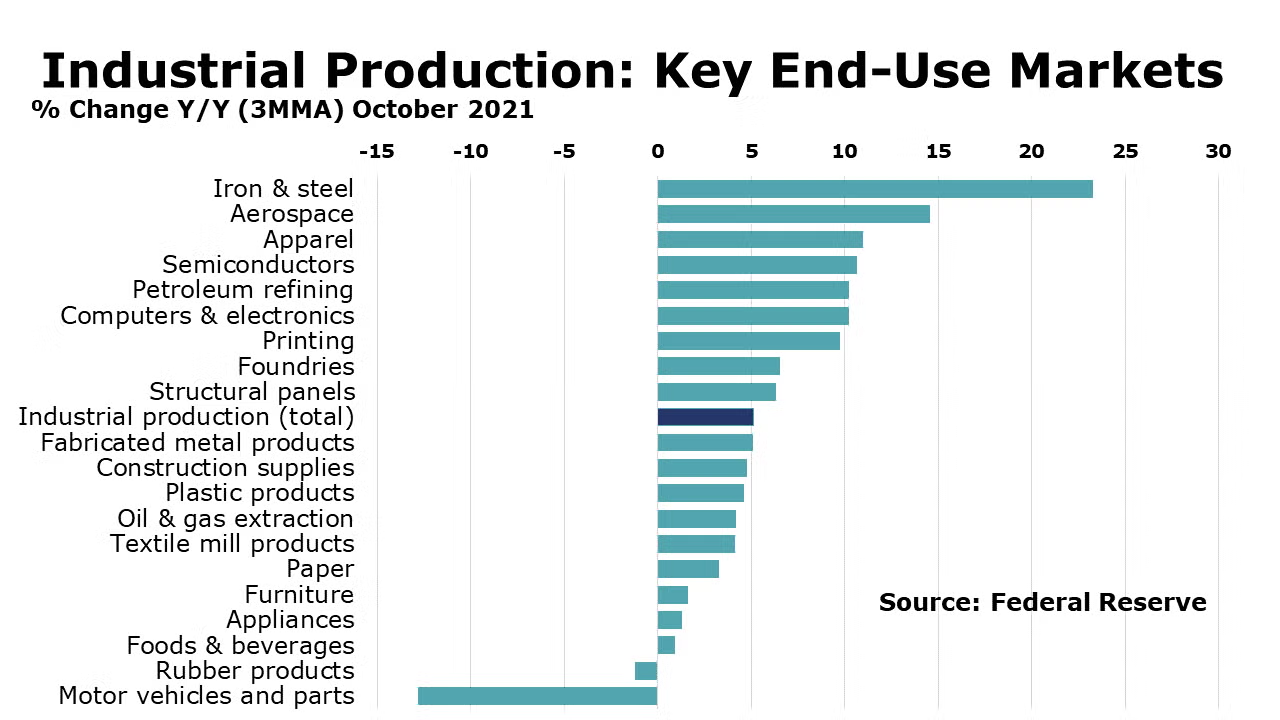
Industrial production rose 1.6% in October—about half due to recovery from Hurricane Ida. Mining and utility output rose 4.1% and 1.2%, respectively. NAICS-based manufacturing output rose 1.3% with the largest gains in motor vehicles and parts, which was offset by a 1.3% decline in machinery. Compared to a year ago, industrial production was up 5.1% Y/Y. Capacity utilization rose 1.2% to 76.4% during the month—0.3% higher than October 2020.
The Conference Board’s Index of Leading Economic Indicators® (LEI) rose by 0.9% in October and follows gains of 0.1% in September and 0.7% in August. It was up 9.3% Y/Y. There were broad gains across the component indicators. The October gain in the LEI suggests that the current economic expansion will continue into 2022, possibly accelerating toward the end of the year.
- Moving toward the end of the year, vaccinations continue to rise. Covid cases in the U.S., which had stabilized at the end of October, have edged higher into November. Deaths, however, continue to trend downward.
- Critical shortages of labor and supplies and transportation bottlenecks across the U.S. and abroad which constrained growth during Q3 have persisted, but signs of easing are emerging in some markets.
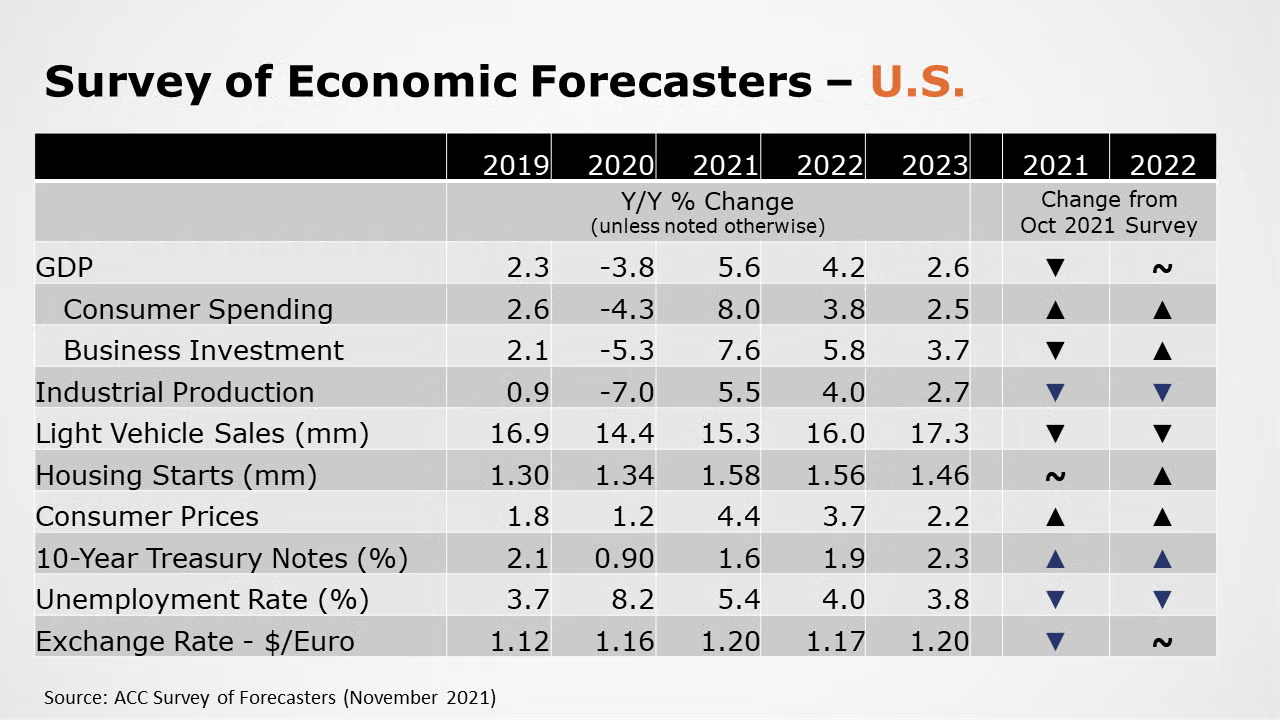
- Expectations among ACC’s panel of forecasters remain positive (though dampened somewhat) for 2021. Expectations are for continued rebound into 2022, though at a slower pace.
- U.S. GDP is now expected to grow by 5.6% in 2021 and reflects downward revisions to the growth forecast over the past few months. In 2022, U.S. GDP is expected to grow 4.2%, above its long-term trend.
- Industrial production, is expected to rise 5.5% in 2021 (lower than last month’s expectations) and 4.0% in 2022.
- Continued curtailments in auto production due to shortages of semiconductors and other components, expectations for light vehicle sales were lowered again to 15.3 million in 2021 and 16.0 million in 2022.
- Expectations for housing starts remained steady at 1.58 million in 2021 and 1.56 million in 2022.
- The unemployment rate is expected to average 5.4% in 2021 (slightly lower than last month) and 4.0% in 2022 (the same as last month).
- With constraints on labor, supplies, and movement of goods, prices have accelerated across the supply chain. Consumer prices are expected to grow by 4.4% in 2021 and 3.7% 2022.
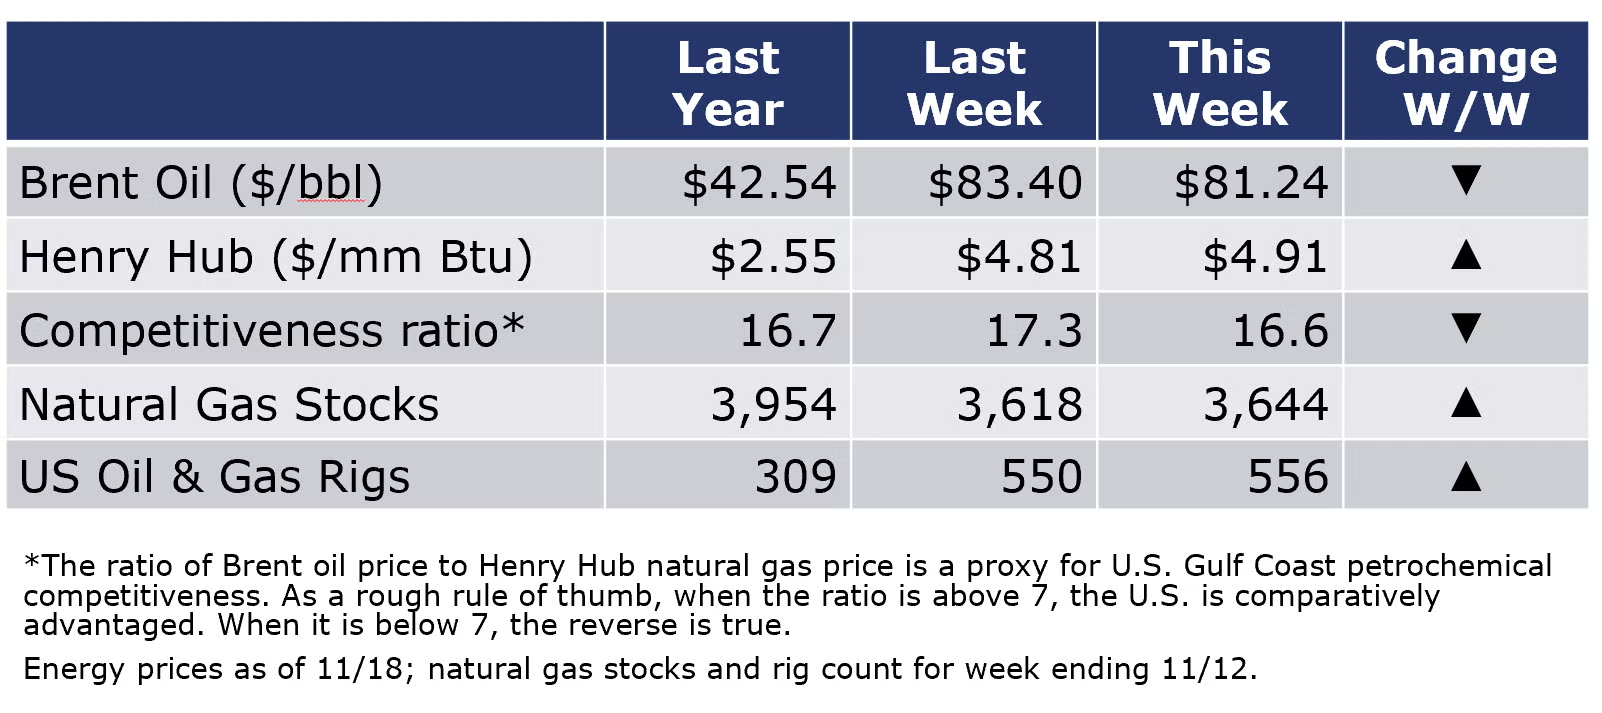
The combined oil and gas rig count rose by six to 550 rigs during the week ending 12 November. Natural gas prices remained high and volatile but finished another week below $5/MMBtu. Oil prices moved lower compared to last week on concerns about rising Covid cases in Europe and anticipation that China and the U.S. may release oil from its strategic reserves.
For the business of chemistry, the indicators still bring to mind a yellow banner for basic and specialty chemicals.
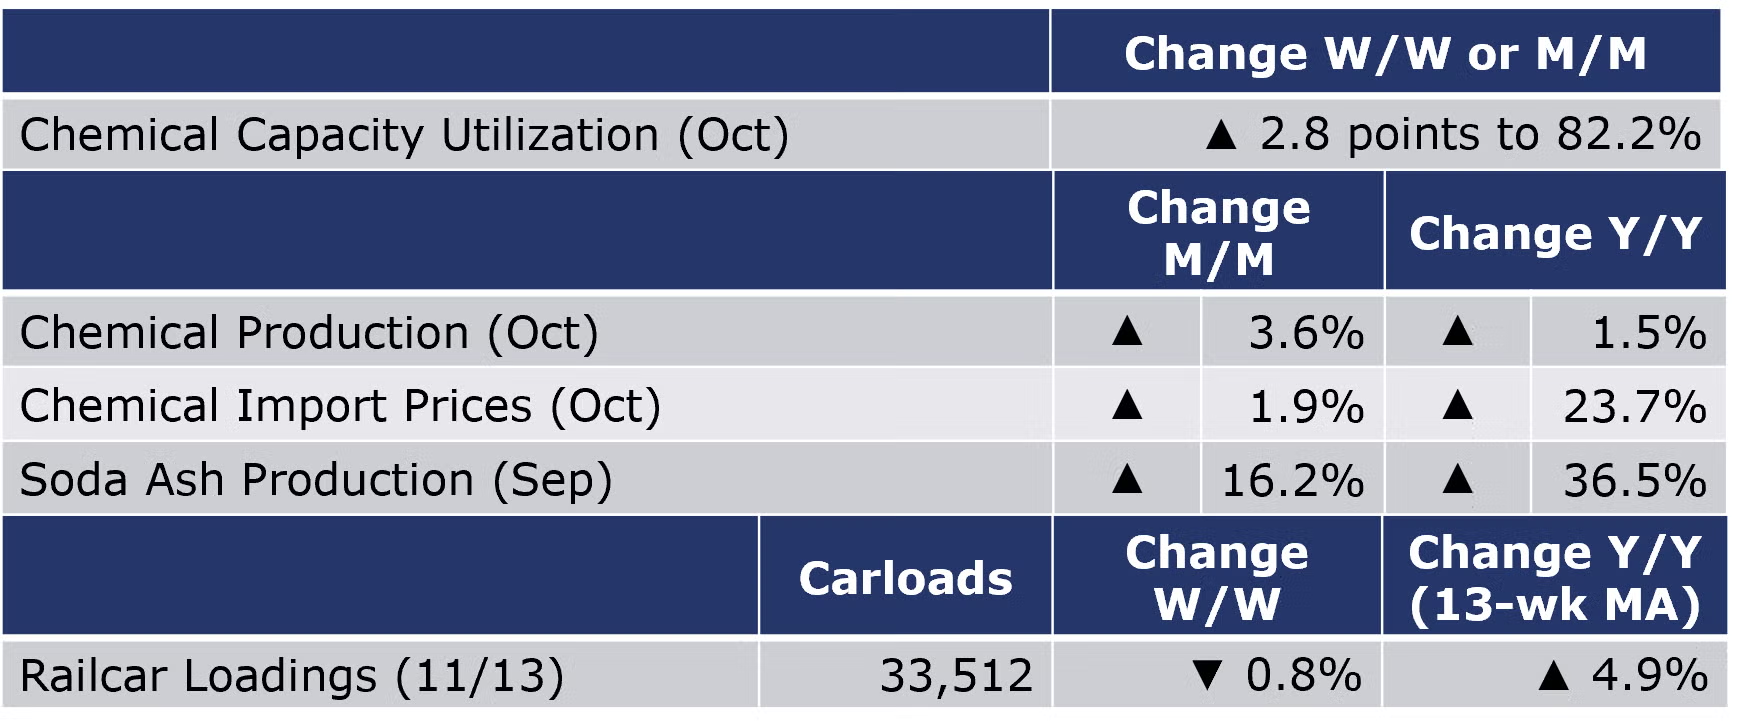
According to data released by the Association of American Railroads, chemical railcar loadings, the best ‘real time’ indicator of chemical industry activity, fell by 268 (0.8%) to 33,512 railcars during the week ending 13 November (week 45). Loadings were up 4.9% Y/Y, up 5.6% YTD/YTD and have been on the rise for 7 of the last 13 weeks.
Chemical import prices rose for a seventeenth consecutive month in October, up by 1.9%. Export prices rose by 1.5%, following a decline in September. Compared to a year ago, prices for imported chemicals were up 23.7% Y/Y while export prices were up by 25.9% Y/Y.
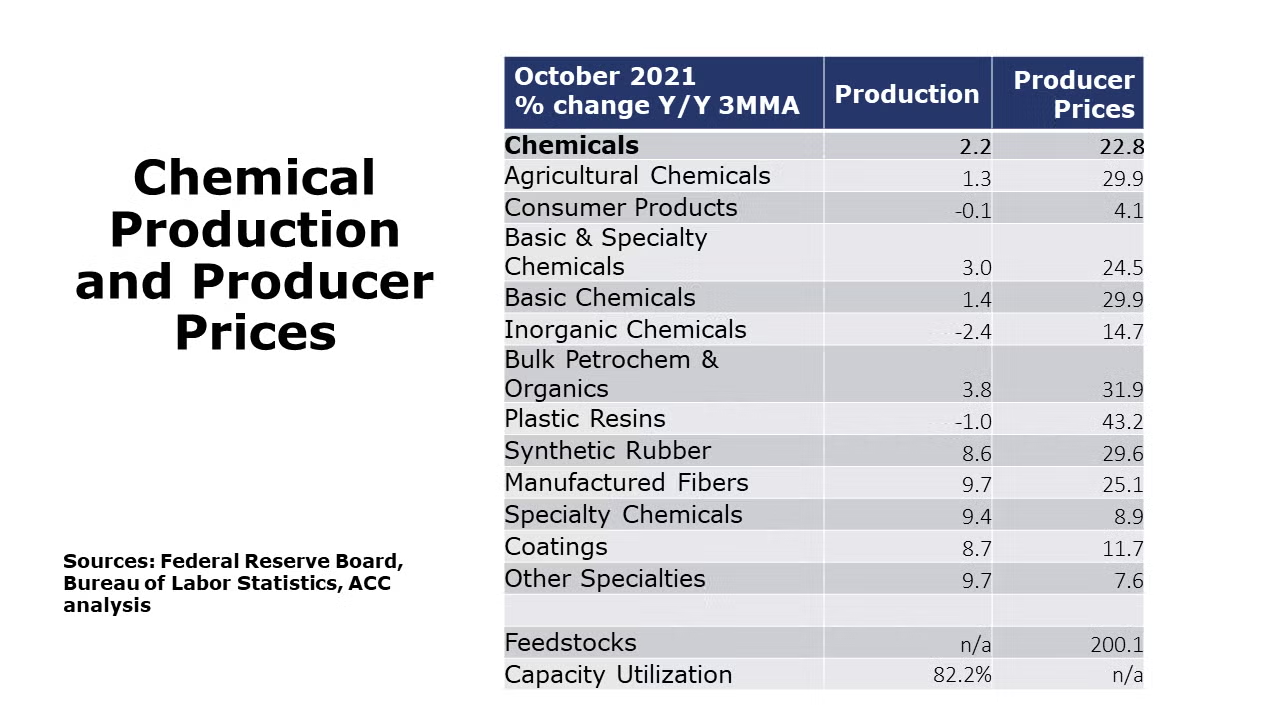
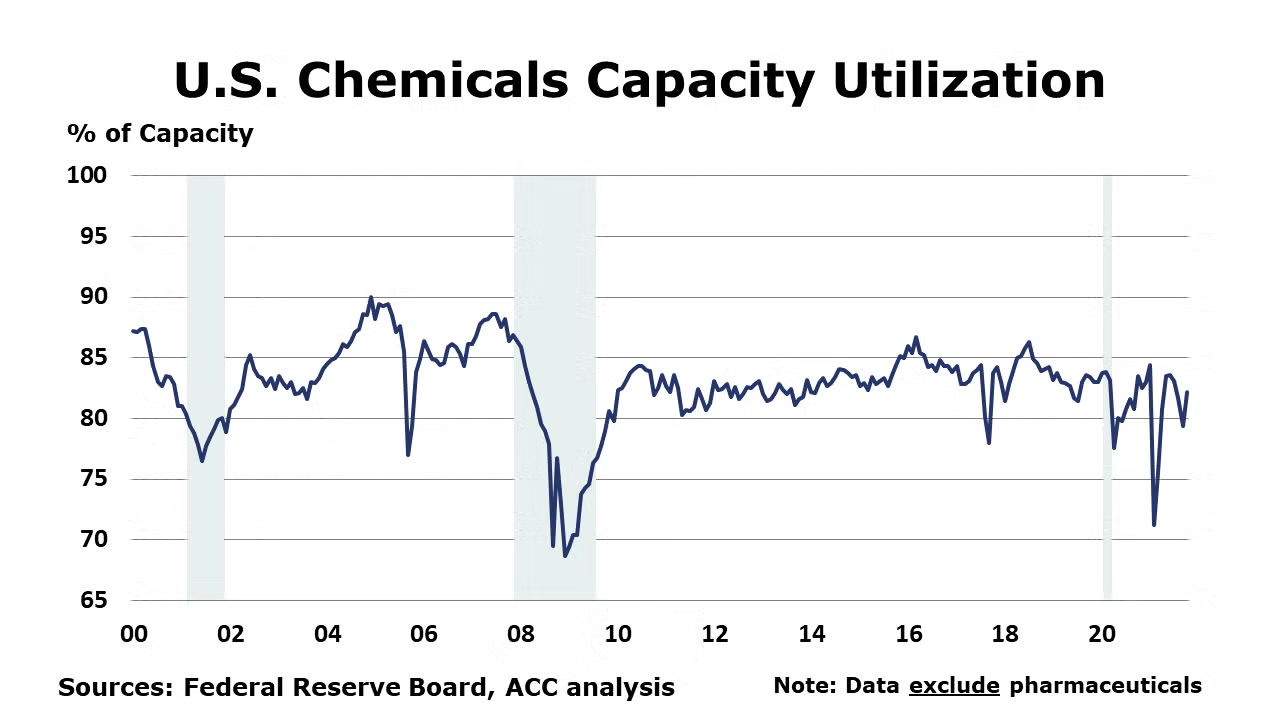
Chemical production rebounded in October, up by 3.6%. This follows declines of 3.0% in September and 1.5% in August as Hurricane Ida disrupted chemical production activity in Louisiana. There were sequential gains in nearly all segments except consumer products and other basic inorganic chemicals. The largest gains were in petrochemicals and organic intermediates, fertilizers, adhesives, coatings, crop protection, plastic resins, and synthetic rubber. Compared to a year ago, chemical production was up by 1.5% Y/Y. Chemical capacity utilization tightened to 82.2% in October following several months of declines. A year ago, chemical capacity utilization was 83.5%.
The U.S. Geological Survey reported that monthly production of soda ash in September was estimated at 1,020 thousand tons, up 16.2% compared to the previous month and up 36.5% Y/Y. Stocks fell 2.5% over August to 230 thousand tons at the end of the month, a 7-day supply. Ending stocks were down 0.9% Y/Y.
Note On the Color Codes
The banner colors represent observations about the current conditions in the overall economy and the business chemistry. For the overall economy we keep a running tab of 20 indicators. The banner color for the macroeconomic section is determined as follows:
Green – 13 or more positives
Yellow – between 8 and 12 positives
Red – 7 or fewer positives
For the chemical industry there are fewer indicators available. As a result we rely upon judgment whether production in the industry (defined as chemicals excluding pharmaceuticals) has increased or decreased three consecutive months.
For More Information
ACC members can access additional data, economic analyses, presentations, outlooks, and weekly economic updates through MemberExchange.
In addition to this weekly report, ACC offers numerous other economic data that cover worldwide production, trade, shipments, inventories, price indices, energy, employment, investment, R&D, EH&S, financial performance measures, macroeconomic data, plus much more. To order, visit http://store.americanchemistry.com/.
Every effort has been made in the preparation of this weekly report to provide the best available information and analysis. However, neither the American Chemistry Council, nor any of its employees, agents or other assigns makes any warranty, expressed or implied, or assumes any liability or responsibility for any use, or the results of such use, of any information or data disclosed in this material.
Contact us at ACC_EconomicsDepartment@americanchemistry.com

