Running tab of macro indicators: 17 out of 20
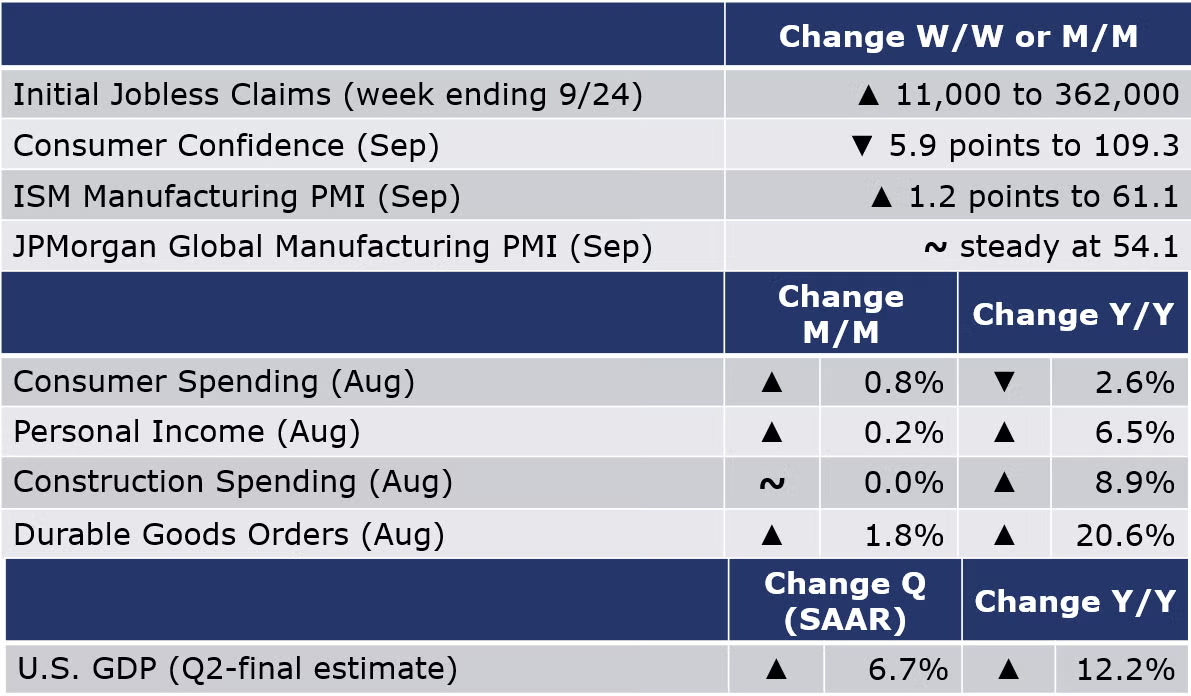
The number of new jobless claims rose, up 11,000 to 362,000 during the week ending 25 September. Continuing claims decreased by 18,000 to 2.8 million and the insured unemployment rate for the week ending 18 September declined by 0.1% points to 2.0%.
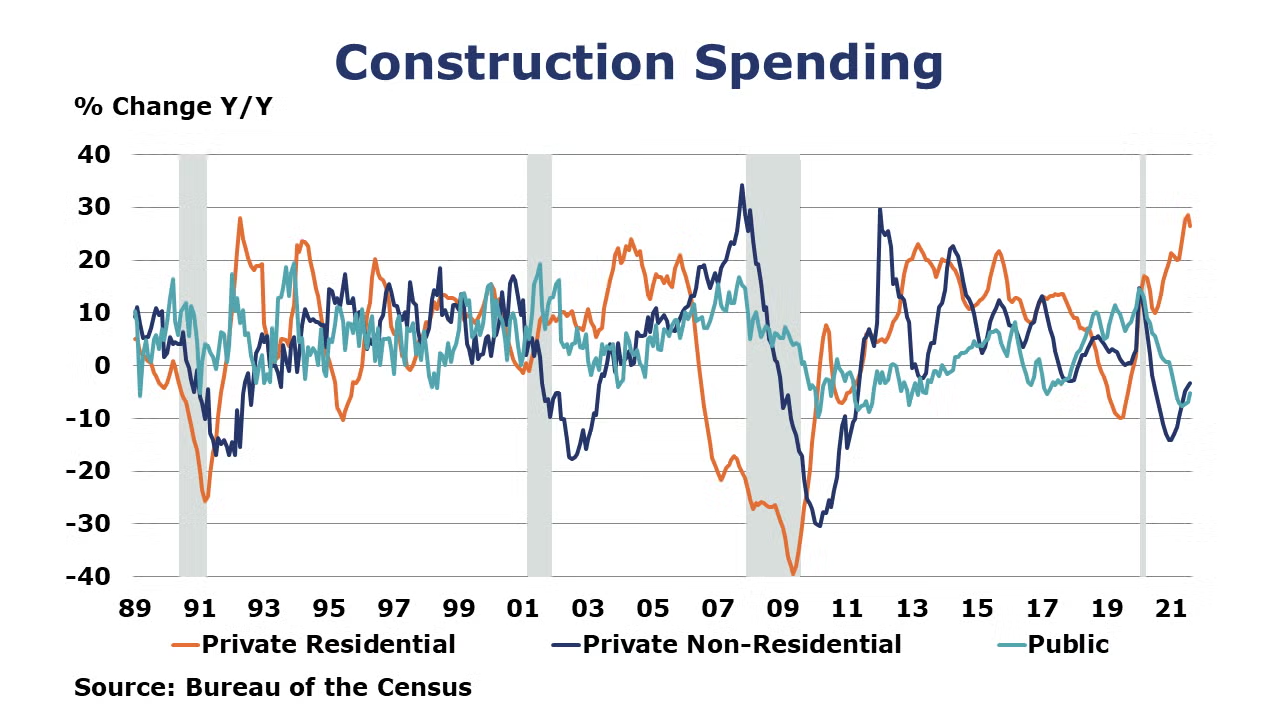
Monthly construction spending flattened out in August at $1.58 trillion but was 8.9% higher than spending in August 2020. During the first 8 months of 2021, spending was up about 7% compared to the same period in 2020. Spending on private construction declined 0.1% as declines in nonresidential offset a small gain in residential. Spending on public construction projects were up 0.5% in August.
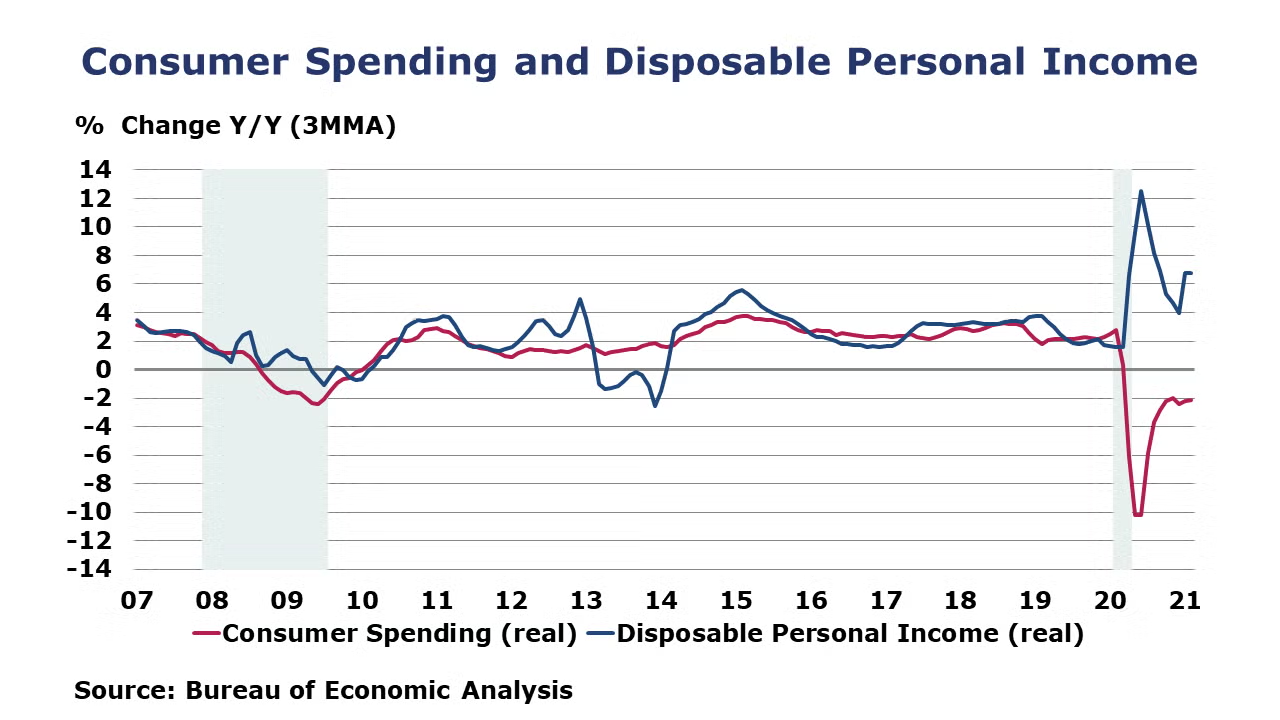
Consumer confidence, although historically high, fell in September for the third straight month. Consumers were reportedly less interested in buying homes, appliances, or vehicles as near-term economic expectations eased. According to estimates released today by BEA, personal income increased $35.5 billion (0.2%) in August, led by an increase in private wages and salaries, as well as advance Child Tax Credit payments, which were partly offset by decreases in payments from the Pandemic Unemployment Compensation program. Disposable personal income (DPI) increased $18.9 billion (0.1%). Consumer spending rose 0.8%, led by increased spending in personal care and clothing services, as well as housing and utilities and healthcare services. Increased spending for household supplies and recreational items were partly offset by a decrease in spending for motor vehicles and parts. The PCE price index increased 0.4% in August and the so-called core PCE price index (excluding food and energy) increased 0.3%, leaving headline prices up 4.3% Y/Y and core prices up 3.6% Y/Y.
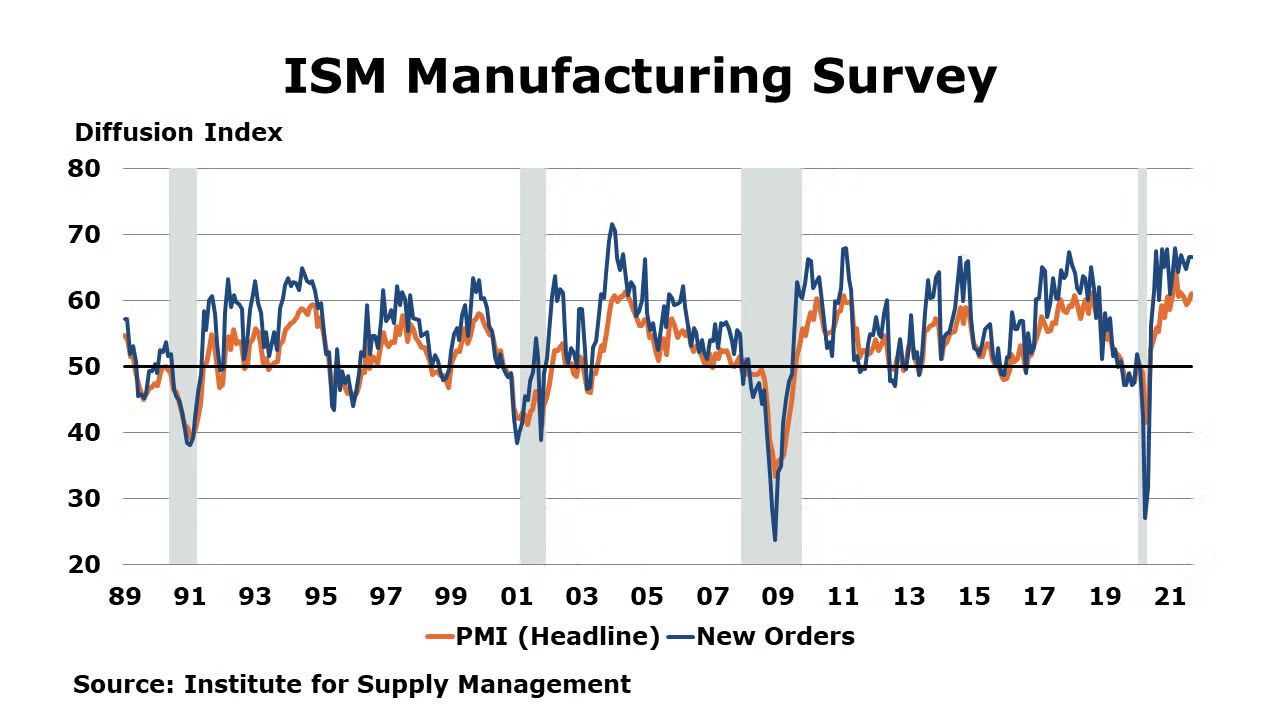
Manufacturing activity continued to expand in September as the ISM Manufacturing PMI rose 1.2 points to 61.1 (a reading above 50 indicates expansion). With the exception of wood products, 17 of the 18 industries covered reported growth. Production expanded at a slower pace. New orders continued to grow, but order backlogs and new export orders grew at a slower pace than last month. Inventories grew at a faster pace. Reflecting ongoing supply chain and logistics challenges, supplier deliveries continued to slow at a faster pace. New orders for durable goods rose 1.8% in August, higher than expected. Gains in orders for fabricated metal products, communications, electrical equipment offset lower orders for primary metals, computers, civilian aircraft and machinery. Core business orders (nondefense capital goods excluding aircraft) rose 0.5%, the sixth consecutive monthly gain.
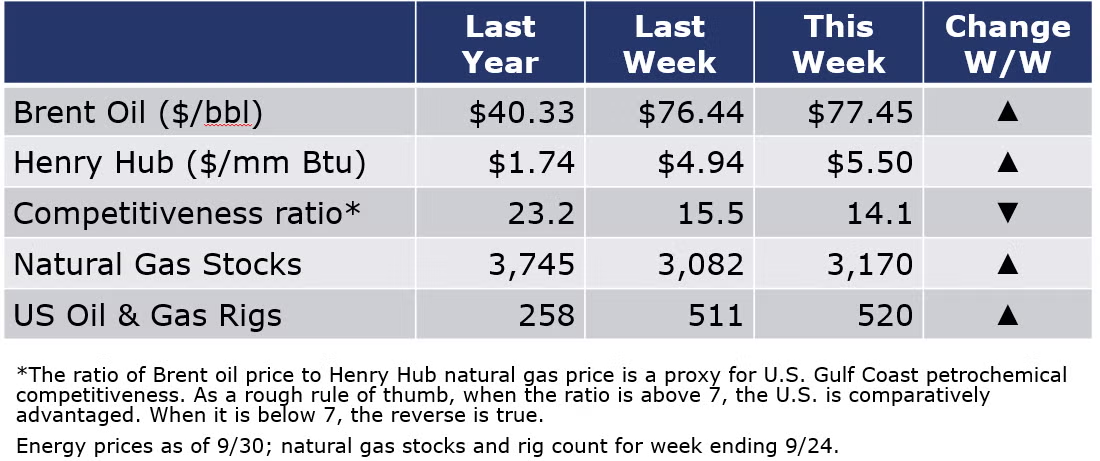
The combined oil and gas rig count rose by nine to 520 rigs during the week ending 24 September. Oil prices remained elevated despite an unexpected gain in U.S. oil inventories last week. China reported that it would buy more oil to ensure its energy supply, however concern is growing amid power shortages and lower manufacturing activity. Natural gas prices continued to rise as demand growth has outpaced growth in supply.
For the business of chemistry, the indicators still bring to mind a green banner for basic and specialty chemicals.
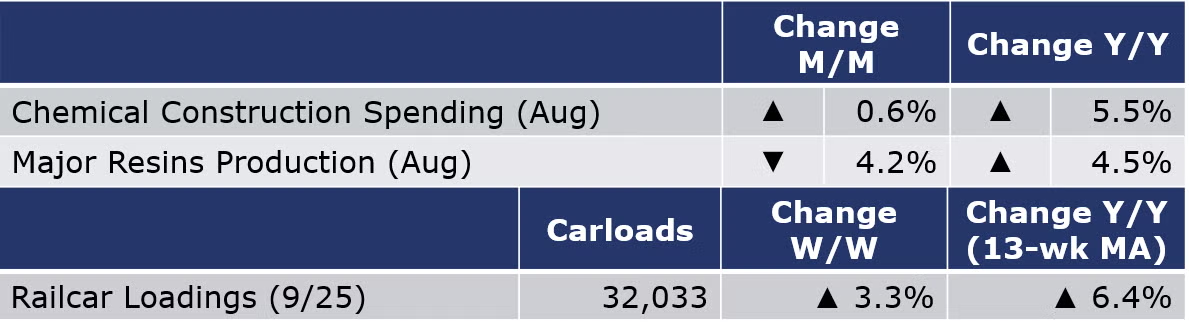
According to data released by the Association of American Railroads, chemical railcar loadings, the best ‘real time’ indicator of chemical industry activity, rose by 1,035 carloads to 32,033 railcars during the week ending 25 September (week 38). Loadings were up 6.4% Y/Y, up 5.6% YTD/YTD and have been on the rise for 7 of the last 13 weeks.
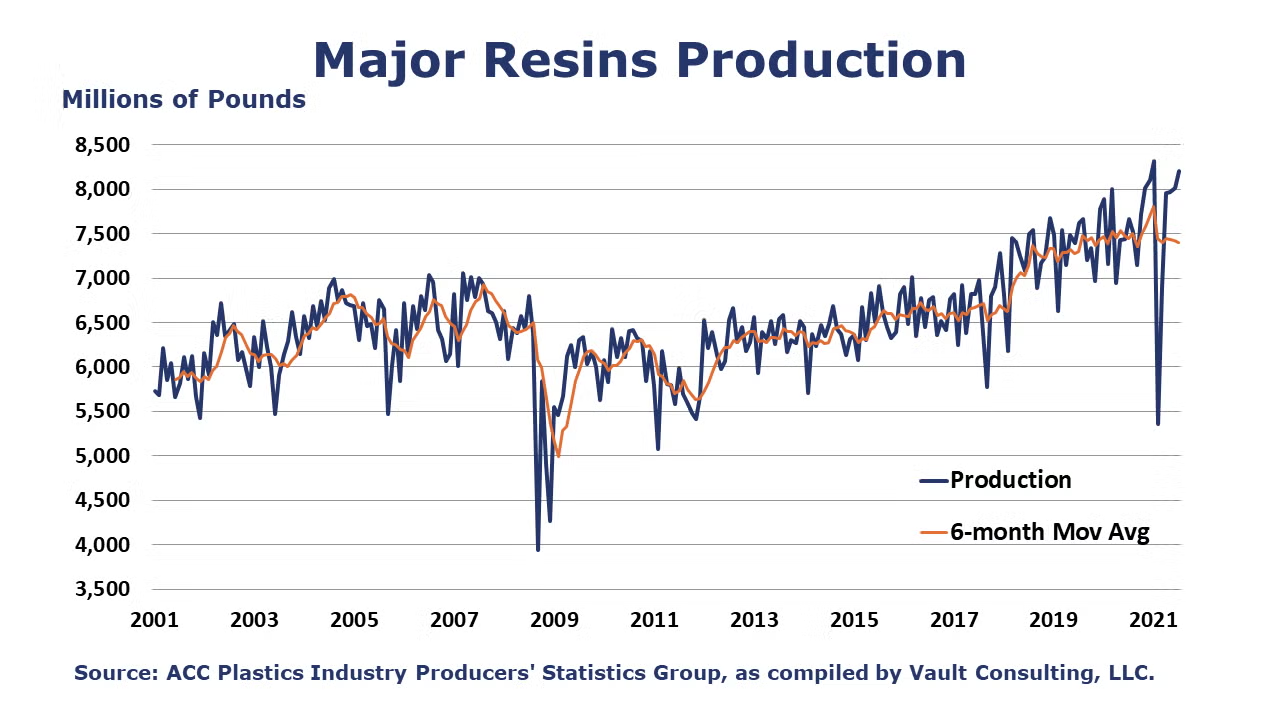
Details on the chemical industry in the ISM PMI report suggest that the chemical industry grew in September with growth in production, new orders, inventories, order backlogs, and new export orders. Imports of chemicals declined. Among the comments from a chemical industry survey respondent: “The impacts from Hurricane Ida on the petrochemical industry has put additional stress on an already fragile supply chain. Logistics with intermodal containers and motor carriers continues to be a challenge for planning deliveries of materials.” Monthly construction spending on chemicals projects rose 0.6% in August, as overall spending across all sectors flattened out. Chemicals construction spending was at $30.1 billion SAAR in August which was 5.5% higher Y/Y. Chemicals spending represented 41% of total manufacturing spending in August.
Note On the Color Codes
The banner colors represent observations about the current conditions in the overall economy and the business chemistry. For the overall economy we keep a running tab of 20 indicators. The banner color for the macroeconomic section is determined as follows:
Green – 13 or more positives
Yellow – between 8 and 12 positives
Red – 7 or fewer positives
For the chemical industry there are fewer indicators available. As a result we rely upon judgment whether production in the industry (defined as chemicals excluding pharmaceuticals) has increased or decreased three consecutive months.
For More Information
ACC members can access additional data, economic analyses, presentations, outlooks, and weekly economic updates through MemberExchange.
In addition to this weekly report, ACC offers numerous other economic data that cover worldwide production, trade, shipments, inventories, price indices, energy, employment, investment, R&D, EH&S, financial performance measures, macroeconomic data, plus much more. To order, visit http://store.americanchemistry.com/.
Every effort has been made in the preparation of this weekly report to provide the best available information and analysis. However, neither the American Chemistry Council, nor any of its employees, agents or other assigns makes any warranty, expressed or implied, or assumes any liability or responsibility for any use, or the results of such use, of any information or data disclosed in this material.
Contact us at ACC_EconomicsDepartment@americanchemistry.com

