Running tab of macro indicators: 15 out of 20
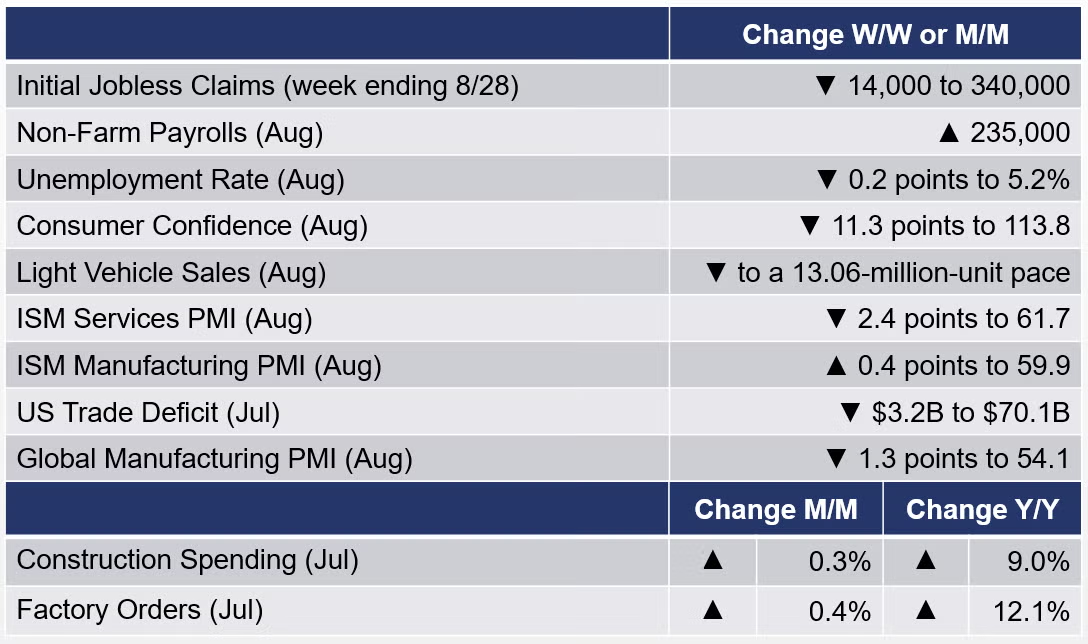
The number of new jobless claims 14,000 to 340,000 during the week ending 28 August. Continuing claims declined by 160,000 to 2.748 million and the insured unemployment rate for the week ending 21 August ease 0.1 percentage points to 2.0%.
The Conference Board reported that its index of consumer confidence fell 11.3 points to 113.8 (1985=100) in August. This is the lowest level since February. Consumers’ assessment of current conditions fell as did their short-term outlook for income, business, and labor market conditions. Concerns about the Delta variant and, to a lesser degree, rising gasoline and food prices were factors. Spending intentions for homes, autos, and major appliances all eased. The share of consumers intending to take a vacation in the next six months, however, continued to climb.
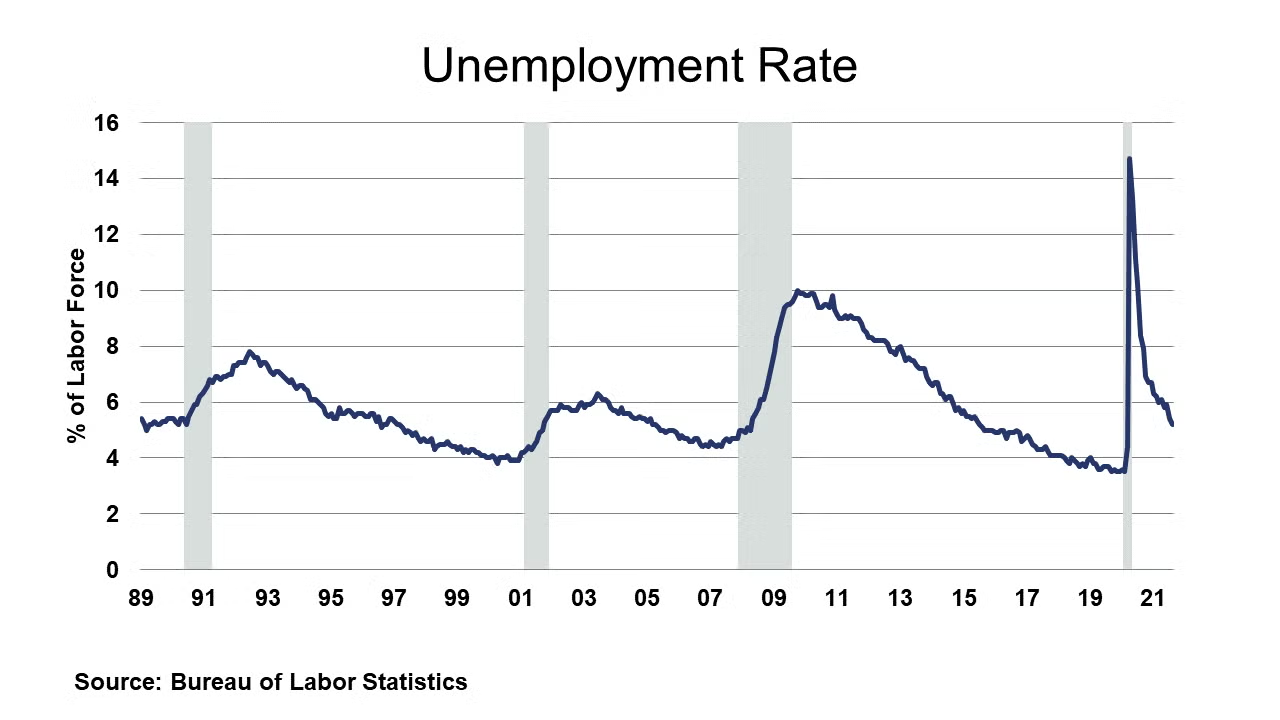
Non-farm payrolls rose a less-than-expected 235,000 in August. This was less than one-half of expectations. That said, the July gain was revised up. In August, notable job gains occurred in professional and business services, transportation and warehousing, private education, manufacturing, and other services. Employment in retail trade, however, declined and there was a big “goose egg” in the creation of leisure and hospitality jobs. Clearly, the Delta variant is affecting the jobs market. Average hourly wages for production and non-supervisory employees rose to $25.99, a level up 4.8% Y/Y. Labor force participation was stable at 61.7% and with a gain in employment, there was a decline in the number of unemployed, and the unemployment rate eased 0.2 percentage points to 5.2%. Labor markets continue to repair, just at slow pace.
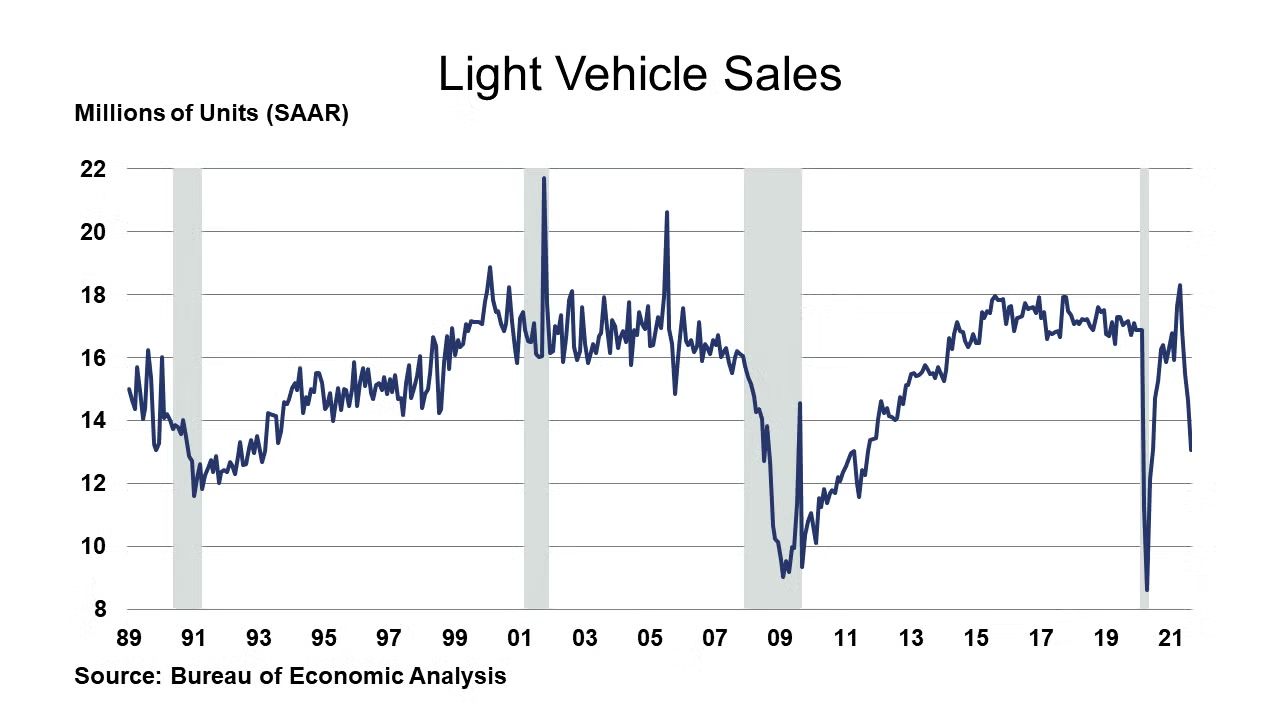
Light vehicle sales fell from a 14.62 million-unit-pace in July to a 13.06-million-unit pace in August. This is about one million units below expectations and is the fourth decline. The weakness reflects inventory shortages and higher prices, as well as the semiconductor shortage (and production cutbacks) and a shift in consumer spending towards services. Weakness was across the board, among both foreign and domestic brands and among automobiles and light-duty trucks, SUVs, etc.
The US trade deficit in goods and services was $70.1 billion in July, down 4.3% from June as exports grew by 1.3% and imports declined 0.2%. Exports rose on higher capital goods (including industrial machinery), consumer goods, and autos and parts. Imports were down in July reflecting gains in autos and parts (mostly cars) offset by lower imports of consumer goods (including cell phones and other household goods), industrial supplies and materials (including lumber and nonmonetary gold).
With gains in residential, highway and street, and other public projects, construction spending rose 0.3% to an annual pace of $1,568.8 billion during July. Overall spending was up 9.0% Y/Y. With potential passage of an infrastructure bill, spending could grow significantly during the long-term.
Factory orders rose 0.4% to $508.1 billion in July and follows a string of gains. Orders for non-defense capital goods excluding aircraft (a proxy for business investment) eased from a 1.0% gain in June to a 0.1% gain in July. Strong gains in primary metals, fabricated metal products, and most types of machinery. Orders for machine tools, a leading segment declined. Shipments continued their rise as did unfilled orders and inventories.
The JPMorgan global PMI for manufacturing fell 1.3 points to 54.1 in August, a six-month low. Supply chain issues continue to restrain output growth. These supply chain issues are driving input costs as new orders growth slowed. Twenty-one of 31 nations reported growth with strength centered in the United States, Japan, Euro Area, the UK, France, India, South Korea, and Brazil. In contrast, China, Russia, and Mexico were among the nations contracting.
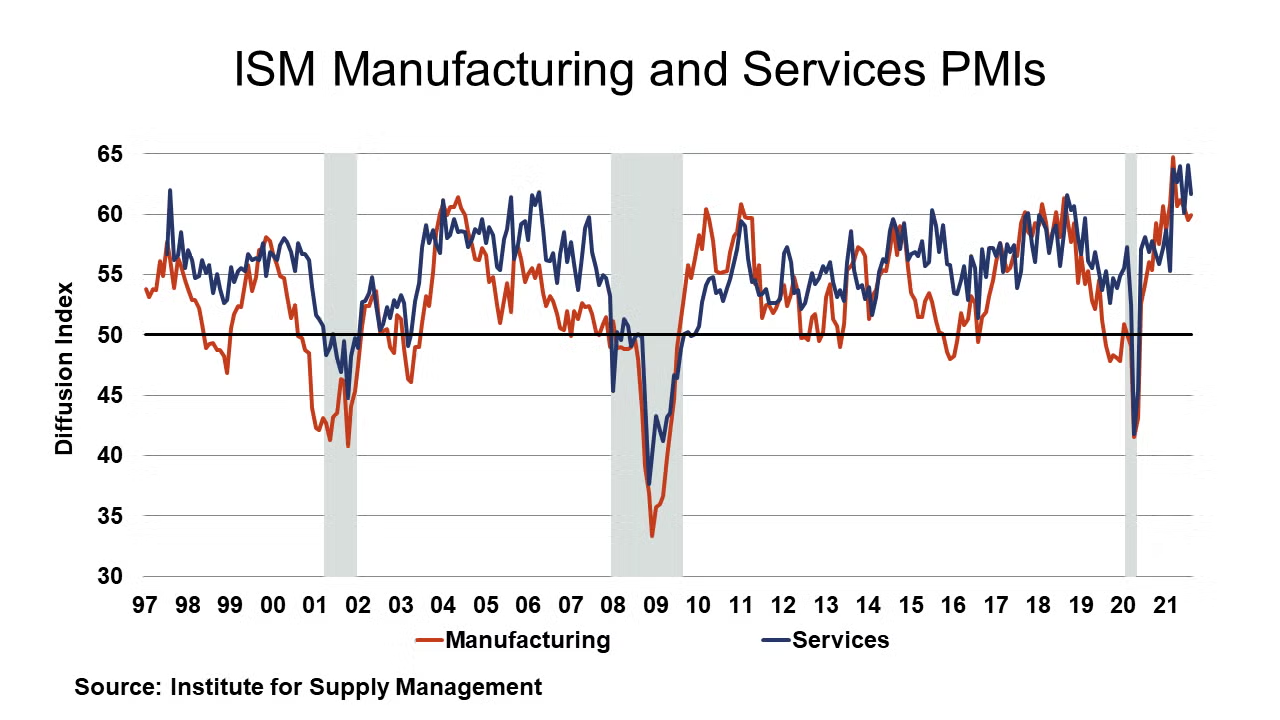
The ISM PMI for manufacturing showed a sector on the move, with the headline PMI rising 0.4 points to 59.9, a strong reading that was above expectations. A larger share of firms reported new orders, production, exports and imports, and the order backlog growing but employment appears to be contracting. Supplier deliveries are slowing at slower rate and raw materials inventories are growing; Customers’ inventories are deemed too low. Overall selling prices continue increasing. Fifteen of the 18 industries reported growth in August. Reflecting the spread of the Delta variant, the ISM PMI for services fell from its record in July, by 2.4 points to 61.7, a still very strong reading. Nearly all components of the index are growing, just with fewer firms reporting so. Reflecting supply chain issues, both inventories and imports contracted. Seventeen of 18 industries expanded.
The Dallas Fed reported that Texas manufacturing activity continued to increase in August, albeit at a slower pace with most measures of business activity pointing to slower but above-average growth this month. Expectations regarding future factory activity remained optimistic. The Chicago chapter of the ISM reported in its Chicago PMI report that its measure of manufacturing, after climbing to a two-month high in July, fell 6.6 points to 66.8 in August. Order backlogs rose sharply while production sank. Firms say the available supply of raw materials and workers isn’t sufficient to keep up with new orders. Order backlogs saw the largest increase, followed by supplier deliveries, while production saw the largest decline.
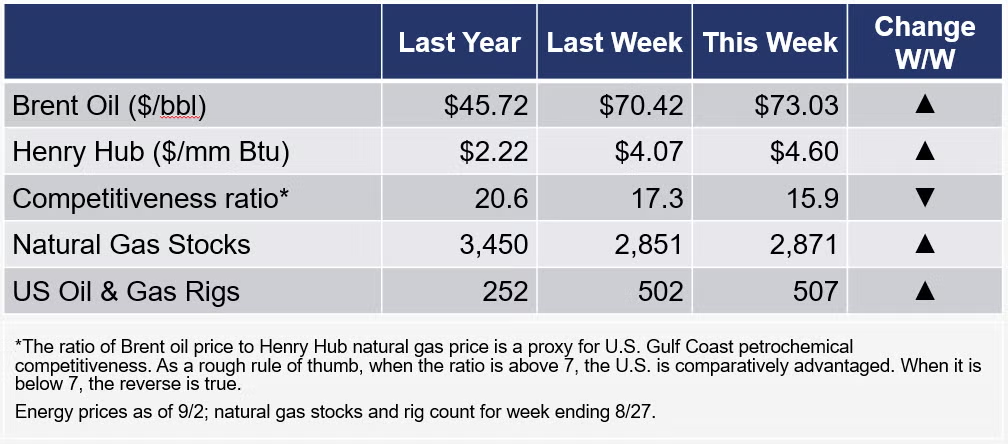
The rig count rose by three to 502 rigs during the week ending 27 August. For that week, there was only a 20 BCF build in natural gas inventories. With nearly all production in the Gulf of Mexico shut down due to Hurricane Ida, we will be going into the winter heating season with a large deficit. Stocks will be well below normal.
For the business of chemistry, the indicators still bring to mind a green banner for basic and specialty chemicals.
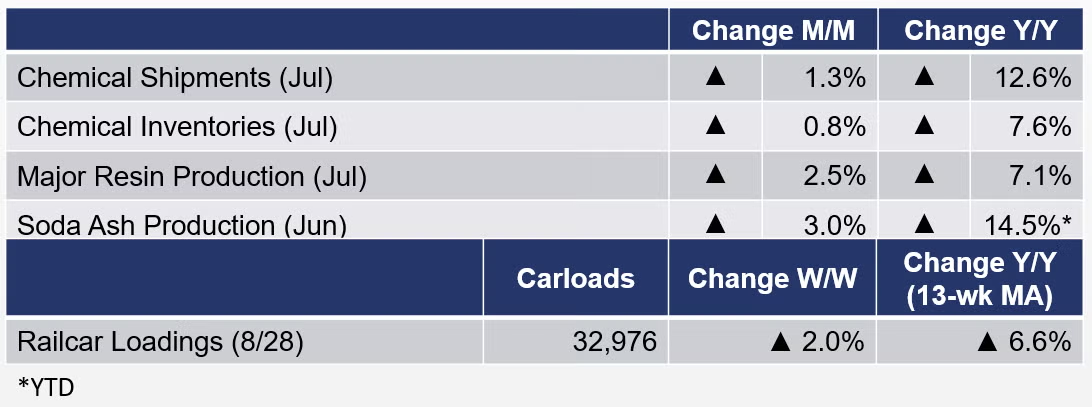
According to data released by the Association of American Railroads, chemical railcar loadings, the best ‘real time’ indicator of chemical industry activity, rose by 2.0% to 32,976 railcars during the week ending 28 August (week 34). Loadings were up 6.6% Y/Y and up 5.9% YTD/YTD. The 13-week moving average, which is used to smooth out volatility, was up 9.5%.
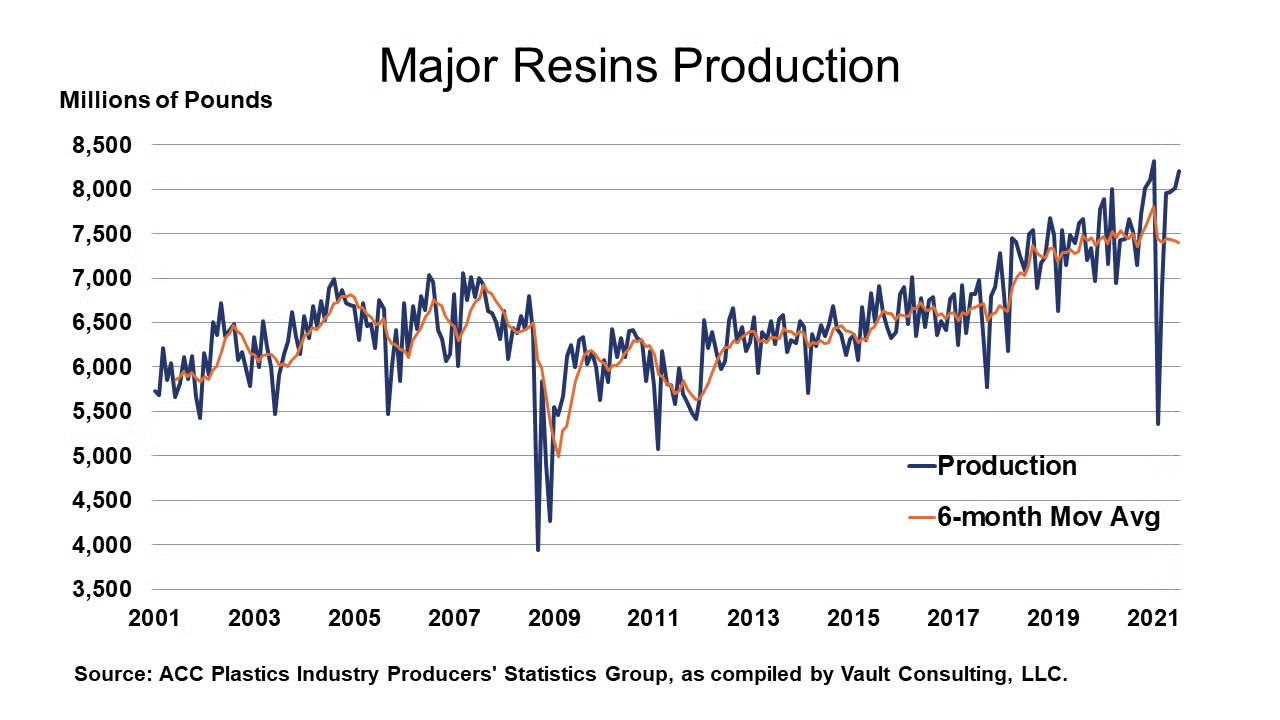
According to the ACC Plastics Industry Producers’ Statistics Group, U.S. production of major plastic resins totaled 8.2 billion pounds during July 2021, up 2.5% percent compared to June, and up 7.1% Y/Y. Year-to-date production was 52.8 billion pounds, a 0.4% increase as compared to the same period in 2020. Sales and captive (internal) use of major plastic resins totaled 7.6 billion pounds during July 2021, down 3.0% compared to the prior month, and down 3.1% Y/Y. Year-to-date sales and captive use were 51.9 billion pounds, a 2.9% decrease as compared to the same period in 2020.
The U.S. Geological Survey reported that monthly production of soda ash in June was 966 thousand tons, up 3.0% compared to the previous month and up 14.5%% Y/Y, on a YTD basis. Stocks fell 16.0% compared to May to 225 thousand tons at the end of the month, a 7-day supply. Ending stocks were less than half compared to June 2020.
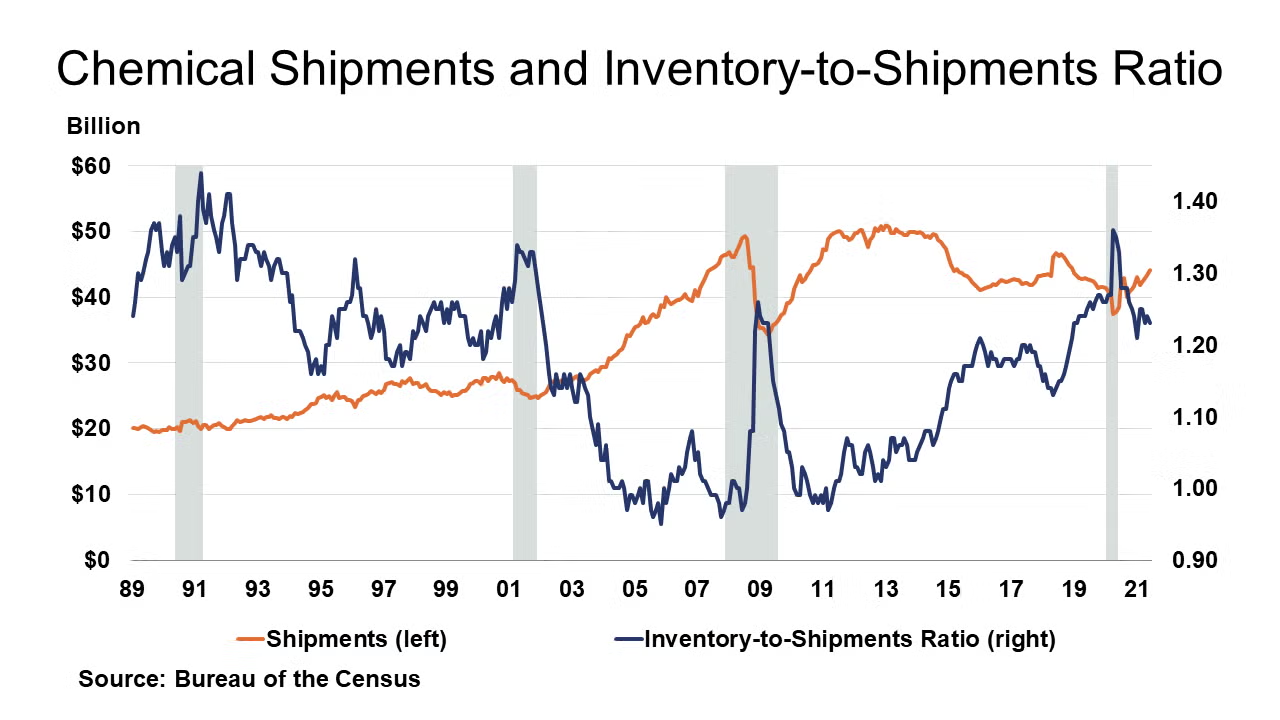
Chemical industry shipments rose 1.3% in July to $44.65 billion, the fifth consecutive gain. Gains were across the board. Inventories rose 0.8% to $54.72 billion at the end of July. Gains were widespread across segments. The inventory-to-sales ratio was stable at 1.23. A year ago, it was 1.28. Shipments were up 12.6% Y/Y and inventories were up 7.6% Y/Y.
The ISM PMI report noted that the chemical industry expanded in August. New orders, production, order backlogs, exports, imports, and inventories expanded. Employment levels apparently contracted. Supplier deliveries were slower and customer inventories were deemed too low. A chemical industry respondent to the ISM report noted: “We continue to see extended lead times due to port delays and sea container tightness. Manufacturing capacities are impacted by a lack of workers reducing output. Several chemical facilities have experienced fires, explosions and spills, further challenging suppliers’ ability to deliver on time and in full.” A chemical industry respondent to the Texas Business Outlook Survey noted that: “We are having increased difficulty in procurement of raw materials and logistical costs.”
The benchmark S&P 500 index rose by 2.9% in August. Chemical equity prices, as measured by the S&P index for chemical companies gained only 0.9% for the month. Equity prices are often a good indicator of future activity and represent one component of the leading economic indicators. Compared to the beginning of the year, chemical equities were up 14.7% while the S&P 500 index was up 20.4% year-to-date.
Overall employment in the business of chemistry rose by 1,400 to 860,400 in August, a level up 2.1% Y/Y. The number of production and non-supervisory employees rose by only 200, to 533,200 and was essentially flat compared to a year earlier. The average workweek eased to 41.5 hours and suggests that hours worked was stable. Allowing for productivity gains, production likely increased, confirming the ISM report. Average hourly wages for production and non-supervisory employees rose to $26.99, a level up 3.5% Y/Y.
THANK YOU and GOODBYE
After 31 years, I am retiring from ACC. This will be my last contribution to the weekly economic report. During these past three decades, I have worked on many interesting and important issues; created our Guide, year-end and mid-year outlooks, weekly economic report, the CAB, global CPRI report, specialties report, chemistry and light vehicles report, and other industry reports; developed some advocacy concepts and analyses; and met a lot of great people at ACC, at our member companies, and our industry.
I plan to step up my teaching and writing (working on three books), spend time with my people, and become more involved in our charitable work.
I appreciate the opportunity that was given to me over 31 years ago. I wish you all, the association, and the industry well in the future.
Kevin Swift
Note On the Color Codes
The banner colors represent observations about the current conditions in the overall economy and the business chemistry. For the overall economy we keep a running tab of 20 indicators. The banner color for the macroeconomic section is determined as follows:
Green – 13 or more positives
Yellow – between 8 and 12 positives
Red – 7 or fewer positives
For the chemical industry there are fewer indicators available. As a result we rely upon judgment whether production in the industry (defined as chemicals excluding pharmaceuticals) has increased or decreased three consecutive months.
For More Information
ACC members can access additional data, economic analyses, presentations, outlooks, and weekly economic updates through MemberExchange.
In addition to this weekly report, ACC offers numerous other economic data that cover worldwide production, trade, shipments, inventories, price indices, energy, employment, investment, R&D, EH&S, financial performance measures, macroeconomic data, plus much more. To order, visit https://store.americanchemistry.com/.
Every effort has been made in the preparation of this weekly report to provide the best available information and analysis. However, neither the American Chemistry Council, nor any of its employees, agents or other assigns makes any warranty, expressed or implied, or assumes any liability or responsibility for any use, or the results of such use, of any information or data disclosed in this material.
Contact us at ACC_EconomicsDepartment@americanchemistry.com
Upcoming Events of Interest
“Challenges and Opportunities: API Supply Chain and Structural Developments” Webinar
William DuBay, Global Head of R&D, SK pharmteco and Andrew J. Carpenter, EVP, Manufacturing, Science & Technology, Phlow Corporation
12:30 – 2:00 pm | 8 September 2021
Société de Chimie Industrielle
www.societe.org
“Specialty & Agro Chemicals America”
8-10 September 2021
Belmond Place | Charleston, SC
Chemicals America, Inc.
https://charleston.chemicalsamerica.com/
“Americas Chemicals and Polymers Conference” Virtual Event
14-15 September 2021
Wood Mackenzie
www.woodmac.com/events/americas-chemicals-and-polymers-conference
Hydrocarbon Processing IRPC Operations Virtual Event
Hydrocarbon Processing/Gulf Energy Information
21-22 September 2021
https://web.cvent.com/event/ec87ac54-5d81-48f7-a4db-c7f82f1c4e73/summary
“Economic, Energy and Chemical Industry Trends and Outlook” Webinar
Dr. Kevin Swift, Chief Economist | American Chemistry Council
12:00 – 2:00 pm | 22 September 2021
Société de Chimie Industrielle
www.societe.org
“Hexion: Sharpening Innovation for Growth” Webinar
Craig Rogerson - Chairman, President & CEO | Hexion
11:00 am | 23 September 2021
CME - Chemical Marketing & Economics
www.cme-stem.org
“Shocks, Shifts, and Emerging Economic Landscape”
63rd NABE Annual Meeting
26-28 September 2021
Marriott Crystal Gateway | Arlington, VA
National Association for Business Economics (NABE)
www.nabe.com
“The Evolving Impact of ESG on the Chemical Industry” Webinar
Joseph Chang - Global Editor | ICIS Chemical Business; Robert Westervelt - Editor-in-Chief | IHS Chemical Week; and Peter Young - CEO & Managing Director | Young & Partners
1:00 – 2:15 pm | 29 September 2021
Société de Chimie Industrielle
www.societe.org


