Running tab of macro indicators: 12 out of 20
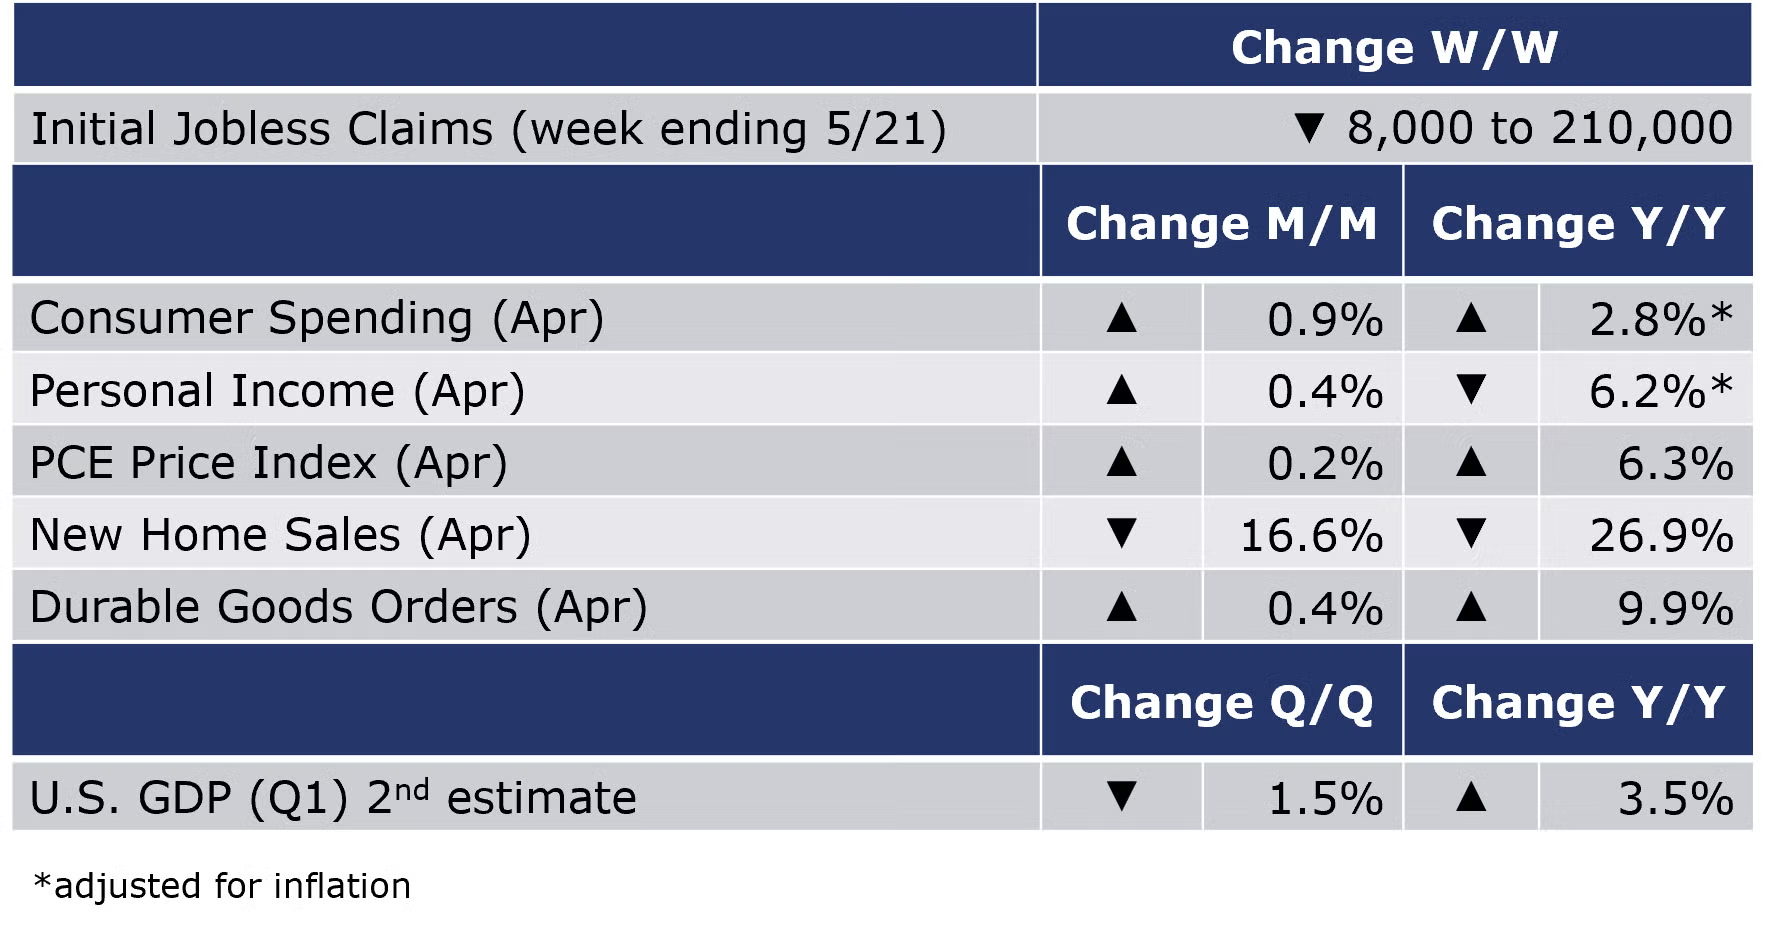
The number of new jobless claims fell by 8,000 to 210,000 during the week ending 21 May. Continued claims rose (by 31,000) to 1.35 million for the week ending 14 May. The insured unemployment rate for the week ending May 14 was 1.0%, slightly higher than the prior week (0.9%).
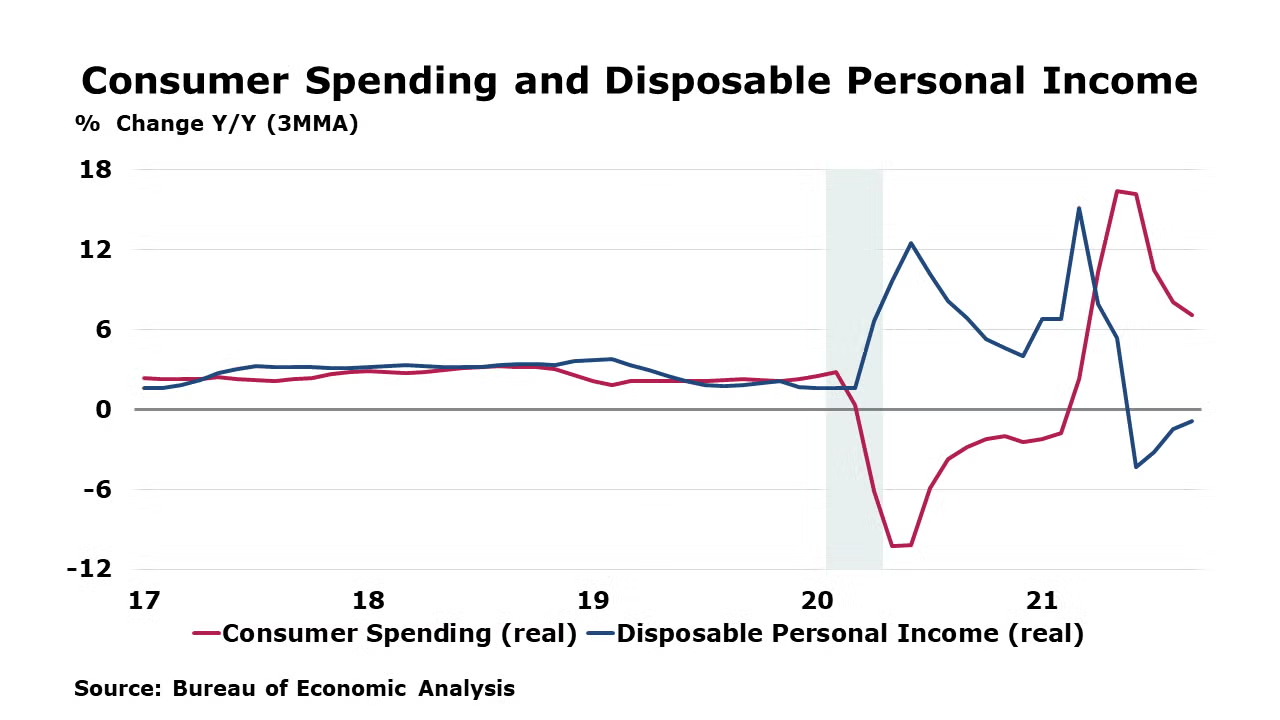
Consumer spending posted another better-than-expected gain. After rising 1.4% in March, personal consumption expenditures (PCE) rose by 0.9% in April with another strong gain in spending on services. Spending on durable goods also increased, but there was a small decline in nondurable goods (likely reflecting lower gasoline prices during April). While some of the gain reflects higher prices, the report suggests that consumers have remained resilient in the face of higher inflation. Spending was partially supported by gains in personal income which rose 0.4%, but was flat after adjusting for inflation and taxes. The savings rate dipped to 4.4%, the lowest since 2008. Personal income was off 6.2% Y/Y (reflecting the removal of federal stimulus) and consumer spending was up by 2.8% Y/Y. The closely-watched PCE price index was up 6.3% Y/Y, a moderation from last month. Excluding food and energy, the core PCE price index was up 4.9% Y/Y, the slowest pace since December, but still well-ahead of the Fed’s 2% target.
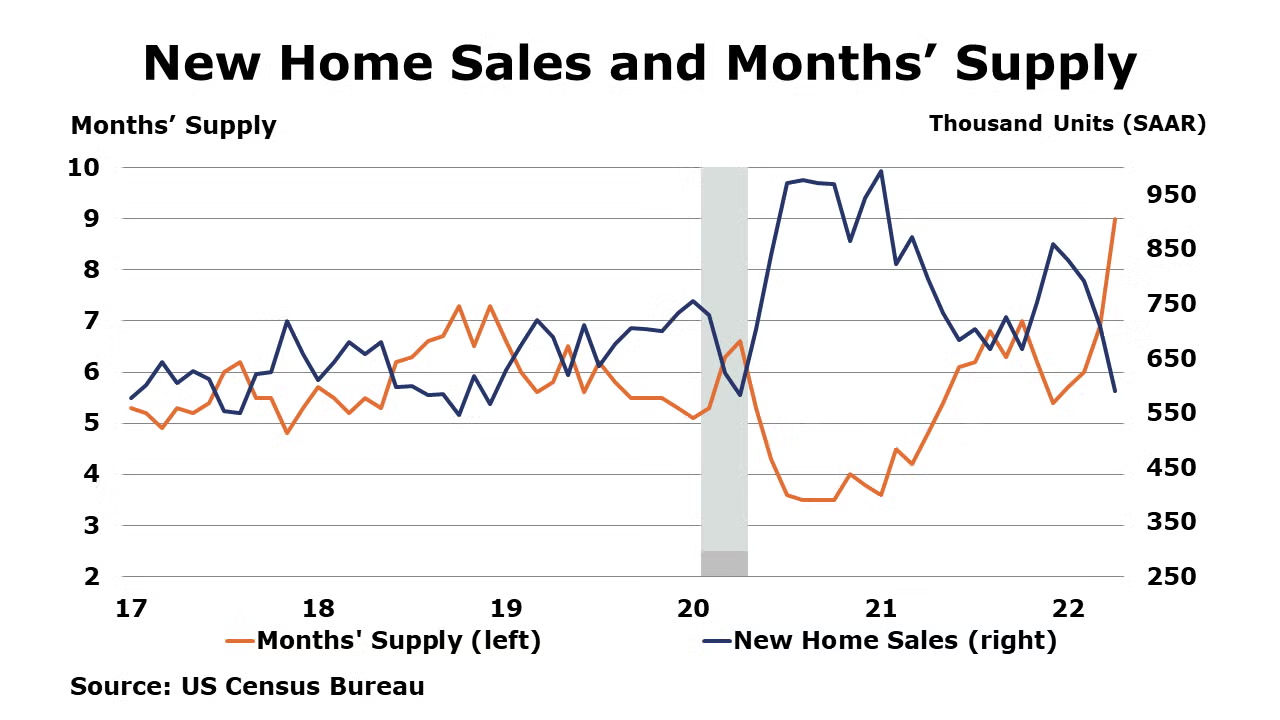
New home sales fell for a fourth straight month in April, off by 16.6%. There were declines in all regions of the country. New home inventories continued to move higher. At the end of April, there was a 9-month supply, compared to 6.9 months in March, 6.0 months in February and 4.7 months in April 2021. Compared to a year ago, new home sales were off by 26.9% while inventories were up 91.5% Y/Y.
Durable goods orders continued to expand in April, up by 0.4% with mixed results within segments. There were gains in new orders of machinery, primary metals, electronics, and aircraft. Orders for computers, computer equipment, fabricated metal products, and motor vehicles were lower. Orders for core business investment goods were ahead by 0.8%. Compared to a year ago, core durable orders were up 6.3% Y/Y while headline orders were up 9.9% Y/Y.
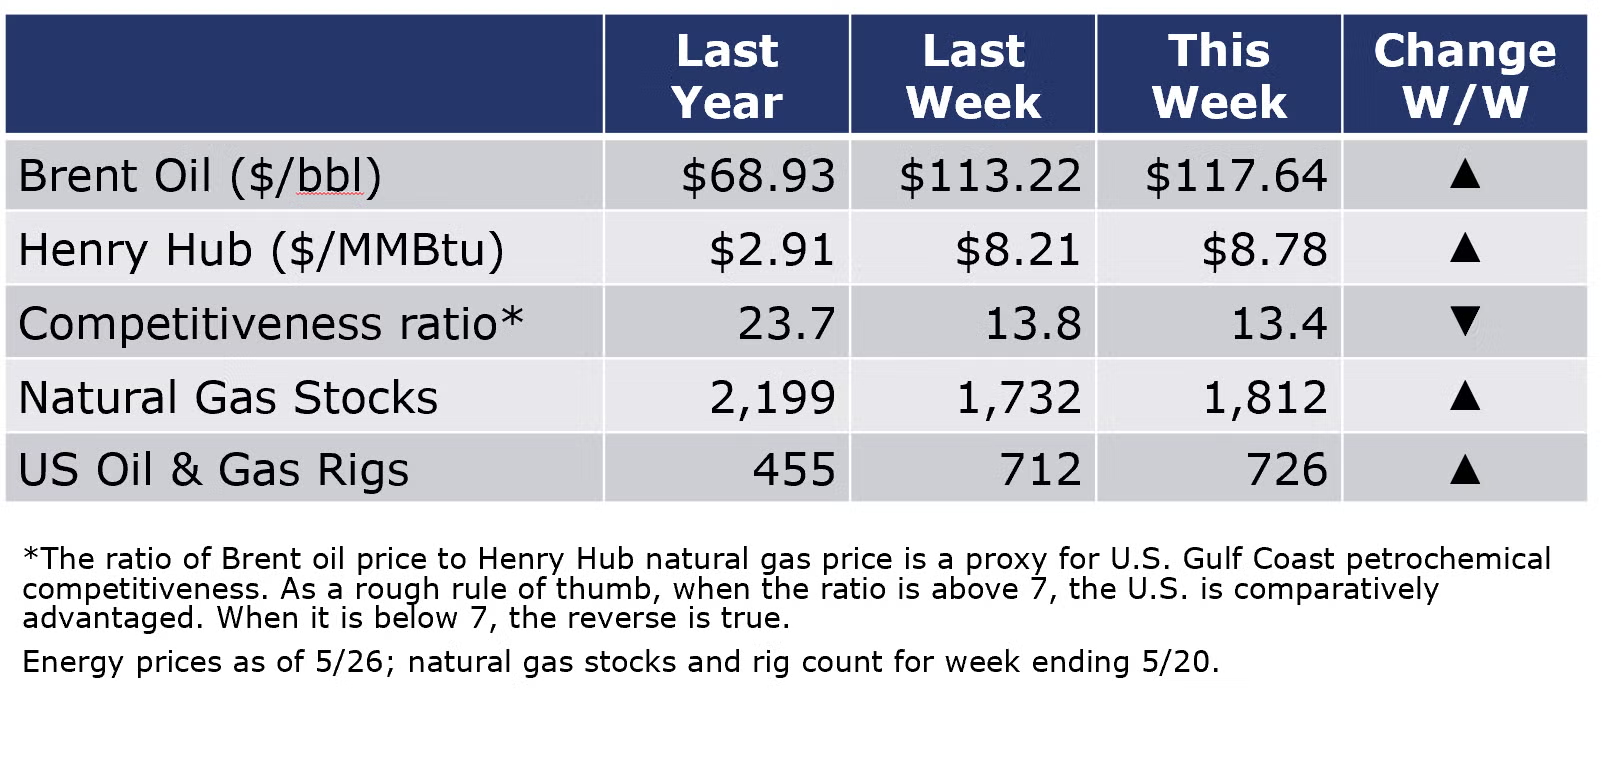
Oil and natural gas prices continued to advance this week to eye watering levels. Concerns that supply growth hasn’t kept pace with demand growth drove the gains. Brent oil was over $117/barrel on Thursday while Henry Hub natural gas prices closed just below $9/MMBtu. The combined oil and gas rig count continued to increase to 726 compared to 455 one year ago. A March survey from the Dallas Fed said that 59% of oil & gas executives “believe investor pressure to maintain capital discipline is the primary reason that publicly-traded oil companies are restraining growth”.
For the business of chemistry, the indicators still bring to mind a green banner for basic and specialty chemicals.
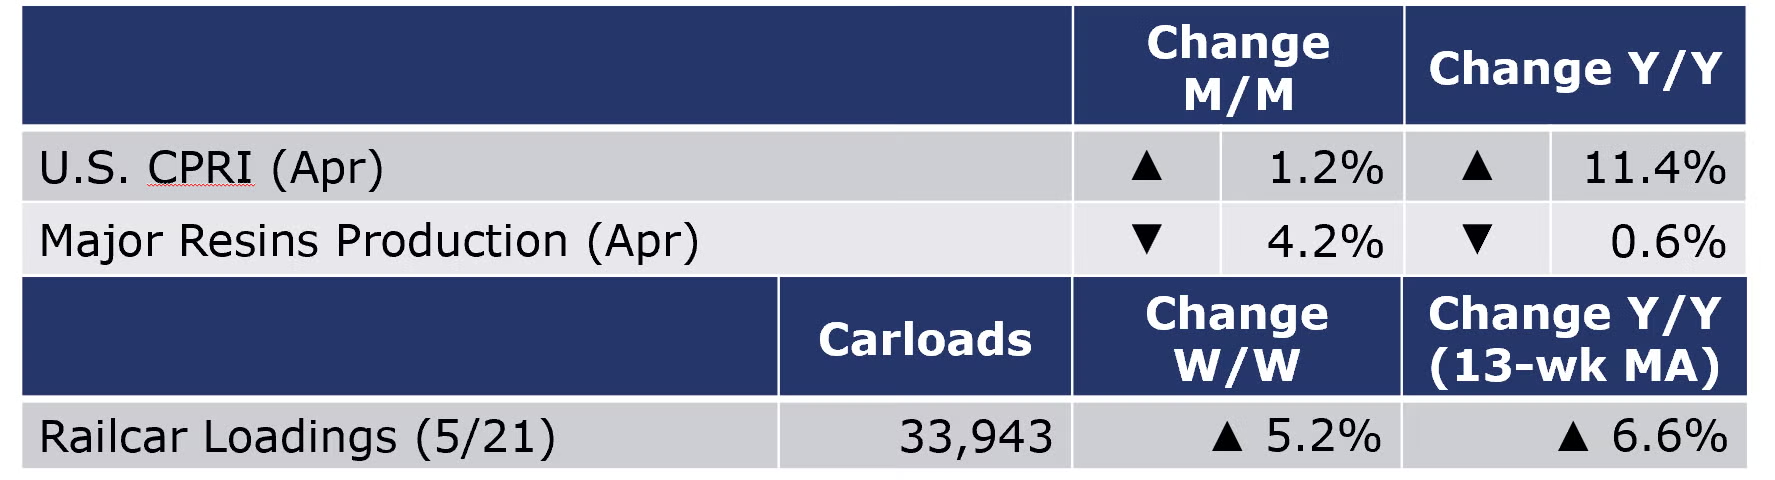
According to data released by the Association of American Railroads, chemical railcar loadings were up 5.2% to 33,943 for the week ending 21 May. Loadings were up 6.6% Y/Y (13-week MA), up 6.5% YTD/YTD and have been on the rise for 7 of the last 13 weeks.
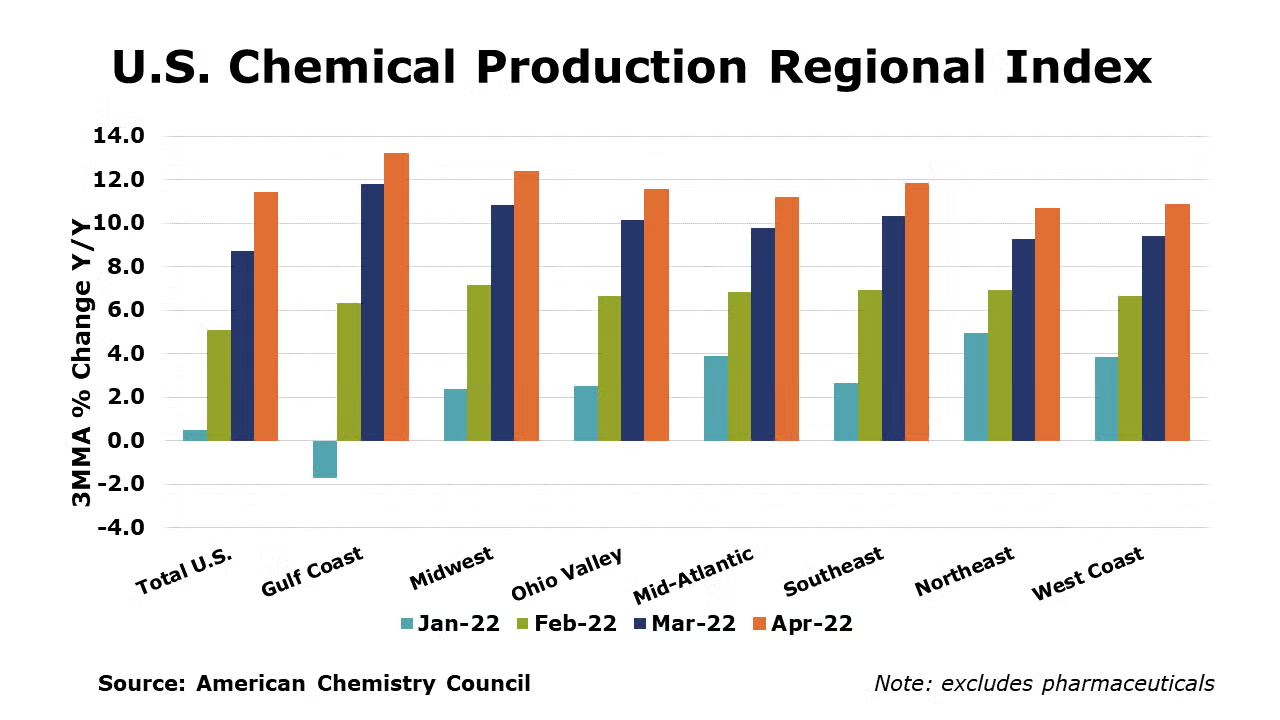
Measured on a three-month moving average (3MMA), basis, the U.S. Chemical Production Regional Index (U.S. CPRI) rose by 1.2% in April. This followed gains of 0.6% in March and 0.2% in February. Chemical output rose across all regions. Compared with April 2021, U.S. chemical production was ahead by 11.4%, an improving comparison from last month and continues to reflect the steep output losses in 2021 from winter storm Uri. Chemical production was higher than a year ago in all regions.
On a 3MMA basis, chemical production rose across all segments. The largest gains were in the production of coatings, adhesives, other specialty chemicals, crop protection chemicals, inorganic chemicals, synthetic rubber, and industrial gases. Other categories saw smaller gains during April.
As nearly all manufactured goods are produced using chemistry in some form, manufacturing activity is an important indicator for chemical demand. Manufacturing output expanded for a seventh consecutive month in April, by 1.0% (3MMA). The 3MMA trend in manufacturing production was broad-based, with gains in the output of food & beverage, construction supplies, aircraft, apparel, foundries, semiconductors, refining, computers & electronics, oil & gas extraction, printing, furniture, plastic products, rubber products, structural panels, fabricated metal products, and paper.
U.S. production of major plastic resins totaled 7.9 billion pounds during April 2022, down 4.2% compared to the prior month, and down 0.6% compared to the same month in 2021, according to statistics from ACC. YTD production was 31.6 billion pounds, a 10.9% increase Y/Y. Sales and captive (internal) use of major plastic resins totaled 7.9 billion pounds, down 8.6% M/M but up 8.7% Y/Y. Year-to-date sales and captive use were 31.4 billion pounds, an 8.2% increase as compared to the same period in 2021.
Note On the Color Codes
The banner colors represent observations about the current conditions in the overall economy and the business chemistry. For the overall economy we keep a running tab of 20 indicators. The banner color for the macroeconomic section is determined as follows:
Green – 13 or more positives
Yellow – between 8 and 12 positives
Red – 7 or fewer positives
For the chemical industry there are fewer indicators available. As a result we rely upon judgment whether production in the industry (defined as chemicals excluding pharmaceuticals) has increased or decreased three consecutive months.
For More Information
ACC members can access additional data, economic analyses, presentations, outlooks, and weekly economic updates through MemberExchange.
In addition to this weekly report, ACC offers numerous other economic data that cover worldwide production, trade, shipments, inventories, price indices, energy, employment, investment, R&D, EH&S, financial performance measures, macroeconomic data, plus much more. To order, visit https://store.americanchemistry.com/.
Every effort has been made in the preparation of this weekly report to provide the best available information and analysis. However, neither the American Chemistry Council, nor any of its employees, agents or other assigns makes any warranty, expressed or implied, or assumes any liability or responsibility for any use, or the results of such use, of any information or data disclosed in this material.
Contact us at ACC_EconomicsDepartment@americanchemistry.com


